Download
1 / 1
10 likes | 111 Views
Validation of Satellite-derived Clear-sky Atmospheric Temperature Inversions in the Arctic. Yinghui Liu 1 , Jeffrey R. Key 2 , Axel Schweiger 3 , Jennifer Francis 4

E N D
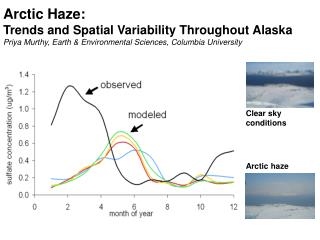
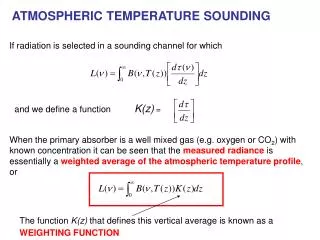
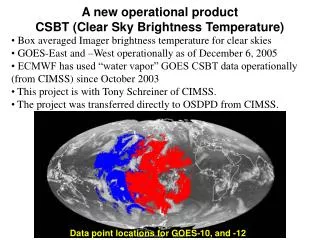
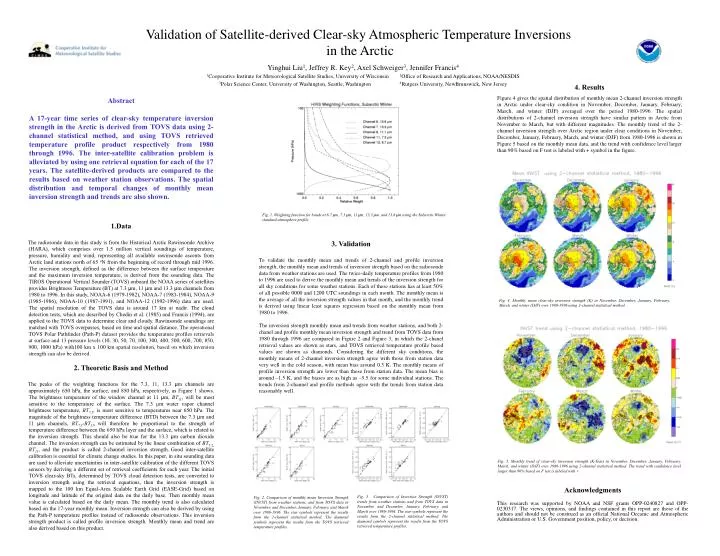
Validation of Satellite-derived Clear-sky Atmospheric Temperature Inversions in the Arctic Yinghui Liu1, Jeffrey R. Key2, Axel Schweiger3, Jennifer Francis4 1Cooperative Institute for Meteorological Satellite Studies, University of Wisconsin 2Office of Research and Applications, NOAA/NESDIS 3Polar Science Center, University of Washington, Seattle, Washington 4Rutgers University, NewBrunswick, New Jersey • Results • Figure 4 gives the spatial distribution of monthly mean 2-channel inversion strength in Arctic under clear-sky condition in November, December, January, February, March, and winter (DJF) averaged over the period 1980-1996. The spatial distributions of 2-channel inversion strength have similar pattern in Arctic from November to March, but with different magnitudes. The monthly trend of the 2-channel inversion strength over Arctic region under clear conditions in November, December, January, February, March, and winter (DJF) from 1980-1996 is shown in Figure 5 based on the monthly mean data, and the trend with confidence level larger than 90% based on F test is labeled with + symbol in the figure. Abstract A 17-year time series of clear-sky temperature inversion strength in the Arctic is derived from TOVS data using 2-channel statistical method, and using TOVS retrieved temperature profile product respectively from 1980 through 1996. The inter-satellite calibration problem is alleviated by using one retrieval equation for each of the 17 years. The satellite-derived products are compared to the results based on weather station observations. The spatial distribution and temporal changes of monthly mean inversion strength and trends are also shown. Fig. 1. Weighting function for bands at 6.7 μm, 7.3 μm, 11 μm, 13.3 μm, and 13.6 μm using the Subarctic Winter standard atmosphere profile. • Data • The radiosonde data in this study is from the Historical Arctic Rawinsonde Archive (HARA), which comprises over 1.5 million vertical soundings of temperature, pressure, humidity and wind, representing all available rawinsonde ascents from Arctic land stations north of 65 oN from the beginning of record through mid 1996. The inversion strength, defined as the difference between the surface temperature and the maximum inversion temperature, is derived from the sounding data.The TIROS Operational Vertical Sounder (TOVS) onboard the NOAA series of satellites provides Brightness Temperature (BT) at 7.3 μm, 11 μm and 13.3 μm channels from 1980 to 1996. In this study, NOAA-6 (1979-1982), NOAA-7 (1983-1984), NOAA-9 (1985-1986), NOAA-10 (1987-1991), and NOAA-12 (1992-1996) data are used. The spatial resolution of the TOVS data is around 17 km at nadir. The cloud detection tests, which are described by Chedin et al. (1985) and Francis (1994), are applied to the TOVS data to determine clear and cloudy. Rawinsonde soundings are matched with TOVS overpasses, based on time and spatial distance. The operational TOVS Polar Pathfinder (Path-P) dataset provides the temperature profiles retrievals at surface and 13 pressure levels (10, 30, 50, 70, 100, 300, 400, 500, 600, 700, 850, 900, 1000 hPa) with100 km x 100 km spatial resolution, based on which inversion strength can also be derived. • 2. Theoretic Basis and Method • The peaks of the weighting functions for the 7.3, 11, 13.3 μm channels are approximately 650 hPa, the surface, and 850 hPa, respectively, as Figure 1 shows. The brightness temperature of the window channel at 11 μm, BT11, will be most sensitive to the temperature of the surface. The 7.3 µm water vapor channel brightness temperature, BT7.3, is most sensitive to temperatures near 650 hPa. The magnitude of the brightness temperature difference (BTD) between the 7.3 μm and 11 μm channels, BT7.3-BT11,will therefore be proportional to the strength of temperature difference between the 650 hPa layer and the surface, which is related to the inversion strength. This should also be true for the 13.3 μm carbon dioxide channel. The inversion strength can be estimated by the linear combination of BT7.2, BT11, and the product is called 2-channel inversion strength.Good inter-satellite calibration is essential for climate change studies. In this paper, in situ sounding data are used to alleviate uncertainties in inter-satellite calibration of the different TOVS sensors by deriving a different set of retrieval coefficients for each year. The initial TOVS clear-sky BTs, determined by TOVS cloud detection tests, are converted to inversion strength using the retrieval equations, then the inversion strength is mapped to the 100 km Equal-Area Scalable Earth Grid (EASE-Grid) based on longitude and latitude of the original data on the daily base. Then monthly mean value is calculated based on the daily mean. The monthly trend is also calculated based on the 17-year monthly mean. Inversion strength can also be derived by using the Path-P temperature profiles instead of radiosonde observations. This inversion strength product is called profile inversion strength. Monthly mean and trend are also derived based on this product. 3. Validation To validate the monthly mean and trends of 2-channel and profile inversion strength, the monthly mean and trends of inversion strength based on the radiosonde data from weather stations are used. The twice-daily temperature profiles from 1980 to 1996 are used to derive the monthly mean and trends of the inversion strength for all sky conditions for some weather stations. Each of these stations has at least 50% of all possible 0000 and 1200 UTC soundings in each month. The monthly mean is the average of all the inversion strength values in that month, and the monthly trend is derived using linear least squares regression based on the monthly mean from 1980 to 1996. The inversion strength monthly mean and trends from weather stations, and both 2-chanel and profile monthly mean inversion strength and trend from TOVS data from 1980 through 1996 are compared in Figure 2 and Figure 3, in which the 2-chanel retrieval values are shown as stars, and TOVS retrieved temperature profile based values are shown as diamonds. Considering the different sky conditions, the monthly means of 2-channel inversion strength agree with those from station data very well in the cold season, with mean bias around 0.3 K. The monthly means of profile inversion strength are lower than those from station data. The mean bias is around –1.5 K, and the biases are as high as –5.5 for some individual stations. The trends from 2-channel and profile methods agree with the trends from station data reasonably well. Fig. 4. Monthly mean clear-sky inversion strength (K) in November, December, January, February, March, and winter (DJF) over 1980-1996 using 2-channel statistical method. Fig. 5. Monthly trend of clear-sky inversion strength (K/Year) in November, December, January, February, March, and winter (DJF) over 1980-1996 using 2-channel statistical method. The trend with confidence level larger than 90% based on F test is labeled with +. Acknowledgments This research was supported by NOAA and NSF grants OPP-0240827 and OPP-0230317. The views, opinions, and findings contained in this report are those of the authors and should not be construed as an official National Oceanic and Atmospheric Administration or U.S. Government position, policy, or decision. Fig. 3. Comparison of Inversion Strength (INVST) trends from weather stations and from TOVS data in November, and December, January, February, and March over 1980-1996. The star symbols represent the results from the 2-channel statistical method. The diamond symbols represent the results from the TOVS retrieved temperature profiles. Fig. 2. Comparison of monthly mean Inversion Strength (INVST) from weather stations, and from TOVS data in November, and December, January, February, and March over 1980-1996. The star symbols represent the results from the 2-channel statistical method. The diamond symbols represent the results from the TOVS retrieved temperature profiles.