Download
1 / 22
220 likes | 314 Views
Mapping Our World. Chapter 2. Your Experience with Maps. Describe the various ways in which you have used maps. Why is it important to use a map?. Discovery Lab.

E N D
Mapping Our World Chapter 2
Your Experience with Maps • Describe the various ways in which you have used maps. • Why is it important to use a map?
Discovery Lab • Have you ever been asked for directions? If so, you know that it’s important to include as much detail as possible so that the person asking for directions will not get lost. You also may have realized that it helps to draw a detailed map of the destination in question.
Your Task • Give verbal diredtions from your school to your home to a classmate who does not know where you live. Include as much detail as possible in your description. • Use a sheet of paper (graph if you have it) and colored pencils to draw a map from your school to your home. Include landmarks and other details. Share with your classmate. • Have your classmate also give you a description of where their home is located in relation to your school also drawing a map.
The big question??? • Which did you find more helpful, the verbal directions or the map? • Share with class • What kind of information did you include in your map? • How could you have improved your map? • What details would you have added?
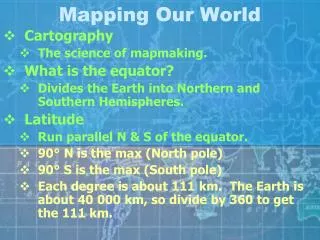
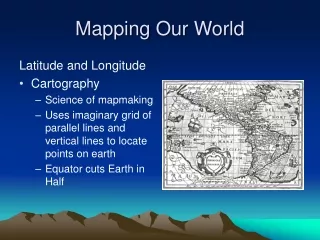
Cartography The science of mapmaking
Latitude Lines running parallel to the equator. It is the distance in degrees north or south of the equator. Locations north of the equator are referred to by degrees north latitude (N). Locations south of the equator are referred to by degrees south latitude (S). For example, Syracuse, New York is located at 43° N latitude. The lines are parallel.
Longitude Locations of east and west direction AKA meridians. It is the distance in degrees east and west of the prime meridian. The prime meridian represents 0° longitude. Points west of the prime meridian are numbered from 0° to 180° west longitude. The same goes for east longitude. The prime meridian runs right through Greenwich, England. Lines are semicircles and extend vertically from pole to pole.
How do we write latitude and longitude locations? • Both latitude and longitude are needed to precisely locate positions on Earth. • When writing coordinates, latitude comes.
TIME ZONES • Earth is divided into 24 time zones. • Why?
Because it takes Earth About 24 hours to rotate on its axis.
Types of Maps • Mercator Projections • Conic Projections • Gnomonic Projections • Topographic Maps
Mercator Projections A map that has parallel lines of latitude and longitude. Recall that lines of longitude meet at the poles. A mercator map will show landmasses.
Conic Projections Is made by projecting points and lines from a globe onto a cone. The cone touches the globe at a particular line of latitude. There is little distortion in the areas or shapes of landmasses that fall along this line of latitude. Used to make weather and road maps.
Gnomonic Projections Is made by projecting points and lines from a globe onto a piece of paper that touches the globe at a single point. Useful for plotting long-distance trips by air and by sea.
Topographic Map Detailed map that shows hills and valleys of an area. It shows changes in elevation. It shows mountains, rivers, forests, and bridges among other features. These maps use lines, symbols, and colors to represent changes in elevation.
Contour Lines, intervals, index contours, and depressions on a topographic map • Contour lines = Elevation (distance of a location above or below sea level). • Contour Intervals = The difference in elevation between two side by side contour lines. Lines close together mean something is steep. • Index Contours = Some contour lines are marked by numbers representing their elevations. • Depression contour lines = Have short lines at right angles to the contour line to indicate depressions. For example, volcanic craters and mines.
Topographic Maps Identify the various contour markings
Map Legend Depicts symbols and explains what they are. For example, black dotted lines are trails, solid red lines are highways, small black squares are buildings.
Map Scale Allows you to measure the distance from one place to another. The map scale is a ratio between distances on a map and actual distances on the surface of Earth.
Remote Sensing • Today, advanced technology has changed the way maps are made. The process of collecting data about Earth from far above Earth’s surface is called remote sensing. • Examples are various satellites such as the Landsat, and Topex/Poseidon satellite.
The Global Positioning System (GPS) Is a radio-navigation system of at least 24 satellites that allows its users to determine their exact position on earth.