Download
1 / 20
200 likes | 305 Views
Land Use Change in North West China. Jeff Bennett. 1. China’s land and water resources. Area of 960 m hectares 40% grassland 17% forests 14% cropland 66% mountainous Dry in the north and west Wet in the south and east. 2. Resource degradation. 38% of total land area “eroded”

E N D
Land Use Change in North West China Jeff Bennett
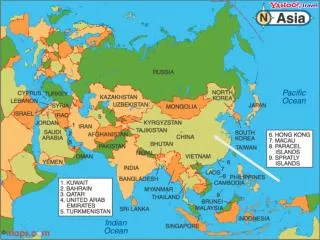
1. China’s land and water resources • Area of 960 m hectares • 40% grassland • 17% forests • 14% cropland • 66% mountainous • Dry in the north and west • Wet in the south and east
2. Resource degradation • 38% of total land area “eroded” • 50% of cropland “eroded” • 34% of grassland moderately to severely degraded • 27% of total area subject to desertification • 10% of total area subject to salinisation
3. Population and resources • 22% of the world’s population on 7% of the world’s arable land • “Mismatch” of population with rainfall distribution • Growing urbanisation across formerly agricultural land • Pressure on resources … a cause of degradation
3. Institutional factors • Grain self-sufficiency policy • Agricultural collectivisation – property rights • Industrialisation policy • State monopoly in agricultural commodity procurement and marketing
Since Household Responsibility System (1978): • Incomplete land tenure – use rights only • Frequent enforced redistributions • Ie Inadequate definition and defence of rights
4. … the consequences • Reduced agricultural productivity • More natural disasters (flooding, dust storms, mud slides ) • Diminished biodiversity • Rivers stop flowing • Air and water quality deterioration
5. The policy response – “Grain for Green” • Convert cropland and “barren land” to forests and grassland to achieve water and soil conservation, but also agricultural restructuring and poverty reduction under the mantle of “sustainable development” • Inception in 1999 • Payments of cash, grain and seedlings to farmers who convert land
6. Adoption • 25 provinces • 1580 counties • 15 million farmer households • Target: net increase in forest and grassland of 32 million hectares
7. Features • 150 kg/mu pa in the south • 100 kg/mu pa in the north • 20 yuan/mu pa in cash • 50 yuan/mu worth of seedlings
8. Terms • Benefits received over 2 years for grassland • 5 years for “commercial forests” • 8 years for “ecological forests” • Difference between commercial and ecological based on planting density • Use rights on converted land extended to 70 years
9. … but is it sustainable? • Are the income streams available from the new land use patterns after the removal of the payments superior to the pre policy amounts? • Price impacts of increased supply of tree products? • Extent of off-farm income? • Grain market responses?
10. … and is it efficient? • What are the biophysical impacts of the project? • What value does the community have for those benefits? • Are the benefits being achieved at the lowest cost? • Does the scheme target farmers with the highest net benefit of conversion? (low opportunity costs plus high environmental impact? • Does the scheme provide perverse incentives (eg to “grow” subsidies not products)?
11. The project • ACIAR funded collaboration between ANU and the China National Forest Economics Development Research Centre (part of the State Forestry Administration) • 3 phases: • Household survey to investigate financial impacts • Broader benefit cost analysis integrating values of environmental impacts • Institutional economic analysis of alternative policy settings
12. Household survey • Conducted 4-28 June 2004 • Involved 405 households in 15 villages across 4 counties in 2 Provinces (Shaanxi and Quinhai) • 2064 people in the households • 31% of respondents illiterate • 75% males • 74% Han, 19% Tibetan
Over 14,000 mu of farm area involved (15 mu=1 ha) • 17 mu per farm in Shaanxi • 39 mu per farm in Quinghai • 4800 mu converted to forestland • 2700 mu converted to grassland • Area sown to crops decreased from 13,500 mu to 4,500 (about one third)
Average cash payments (pa) • Bin Xian – 47 Yuan • An Sai – 340 Yuan • Gong He – 565 Yuan • Min He – 160 Yuan • (A$1 = 6.5 Yuan) • Average grain subsidy (pa) • Bin Xian – 425 jin • An Sai – 3167 jin • Gong He – 5670 jin • Min He – 1640 jin • (I jin = 500 gm)
13. Before and after GFGP • Labour input • 293 to 196 days per h’hold • Crop seed costs • Y 530 to Y 334 per h’hold • Crop Output • Shaanxi – down 70% • Quinghai – down 17% • Off-farm income • 213 people to 279 people • Y 3074 to 3900 per person
14. Work underway • Analysis of the household data to estimate impact on net income • Prediction of biophysical impacts of the policy • Water quality and quantity • Air quality
15. Project information • Project web-site • Downloadable papers • Up dates on progress • http://apseg.anu.edu.au/staff/jb_suslndrr.php