Download
1 / 27
310 likes | 584 Views
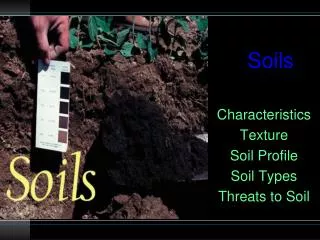
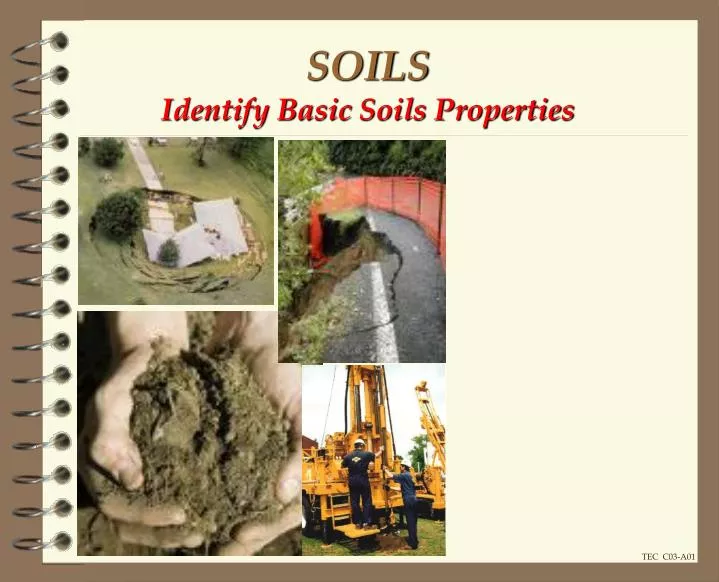
SOILS Identify Basic Soils Properties. TEC C03-A01. Why is Soil important ?. It is the foundation for all types of pavement systems and building structures. What is Soil ... is the entire unconsolidated earthen material that overlies and excludes bedrock; plus

E N D
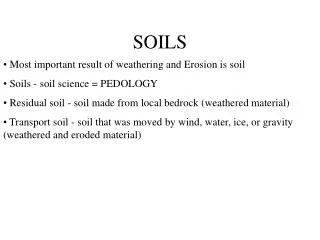
SOILSIdentify Basic Soils Properties TEC C03-A01
Why isSoil important ? It is the foundation for all types of pavement systems and building structures.
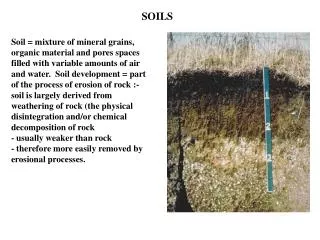
What is Soil ... is the entire unconsolidated earthen material that overlies and excludes bedrock; plus the water, air, organic matter, and other substances that may be contained therein.
BASIC PHYSICAL PROPERTIES Engineers evaluate soils by the following Basic Physical Properties: • GRADATION of sizes of the different particles • BEARING CAPACITY as reflected by soils density • PARTICLE SHAPES interlock according to shapes; this affects strength An engineer will also consider the effect of water on various types of soil for the project.
PHYSICAL PROPERTIES ….a soil’s properties help determine the engineering characteristics. • GRAIN SIZE • PARTICAL SHAPE • GRADATION • DENSITY • SPECIFIC GRAVITY • MOISTURE • CONSISTENCY • ORGANIC SOIL
GRAIN / PARTICLE SIZE • + 3” • - 3” • + #4 • #4 • + #200 • - #200 COBBLES GRAVELS SANDS FINES (CLAY OR SILT) } }
GRAIN/PARTICLE SHAPE The shape of soil particles influences the strength and stability of a soil. BULKY Gravels, sands and silt fall into thebulky shape ...relatively equal in all three dimensions. Bulky shapes are further subdivided based upon the effects of weathering. They may be angular, subangular, subrounded, or rounded. WHAT ARE THE 2 TYPES? PLATY Particles of clay exhibit a platyshape ... one dimension is very small compared to the other two.
Theshapeof soil particles influences the strength and stability of a soil. bulky shapes angular subangular subrounded rounded platy shape
GRADATION The distribution of the different size particles in a soil mass is the gradation. • Well-gradedsoils have a good range of all • representative particle sizes between the largest • and the smallest. • Poorly-gradedsoils contain either a narrow range • of particle sizes or lack some intermediate sizes. • Uniformly gradedhave a narrow range of sizes. • Gap, step, or skip gradedhave some • intermediate sizes missing or not well • represented. WHAT ARE THE 2 TYPES?
Well-graded Uniformly graded Gap, step, or skip graded GRADATION
DENSITY • Density is how closely packed • or loose the soil structure is. • A density structure provides • interlocking of larger particles • with smaller particles filling the • voids between larger particles.
SPECIFIC GRAVITY • Ratio between the weight-per-unit volume of • a given soil sample and the weight-per-unit • volume of a similar volume of water at a stated • temperature. • Specific Gravity of water is 1, Gold is 18. • If a soil has a Specific Gravity of 2.72, then • it is 2.72 times heavier than water.
MOISTURE Moisture Contentis often the most important factor affecting a soils behavior. It is the proportion of the weight of water to the weight of the solid (dry) mineral grains in the soil.
MOISTURE • Moisture has its greatest effect on the behavior of • fine-grained soils such as silts and clays. • Coarse-grained soils with larger voids • Are less susceptible to capillary action • Hold less water • Tend to drain more freely • Clay soil particles retard movement of water • Vary from liquid to brick hard • Impervious to passage of free moisture
Soil Moistureoccurs in five types: SURFACE WATER … water from precipitation or runoff. … collected or held in pools or layers beneath surface by a restricting layer of soil or rock. SUBSURFACE WATER GRAVITATIONAL PULL … seeks lower layer & moves through voids until it reaches a restriction. … voids in soil may form tunnels & tubes and cause water to rise in the tubes CAPILLARY ACTION … water that may be present as thin films. ABSORBED WATER & HYGROSCOPIC MOISTURE
PLASTICITY & COHESION • Plasticity is a property of fine-grained • soils that allows it to be deformed without • cracking or breaking. • The Plasticity Index (PI) is used to • determine weather soil is cohesive. Not all • plastic soils are cohesive. (PURE SILT) • Soil plasticity is determined by observing • the different physical states a soil passes • through as the moisture content changes.
CONSISTANCY • Consistency- four states of consistency for fined grained soils (liquid, plastic, semisolid and solid). • The dividing line between these states of consistency are called the Liquid Limit (LL) and the Plastic Limit (PL). All are quantified in terms of water content (w).
SOIL MOISTURE STATES %W INCREASING %W %W LOW %W HIGH %W PLASTIC STATE SOLID STATE SEMI-SOLID STATE LIQUID STATE PI PL LL PI = LL - PL
60 50 “A” LINE PI = 0.73 (LL - 20) CH OR OH 40 PLASTICITY INDEX (PI) “U” LINE 30 PI = 0.9 (LL - 8) 20 CL OR OL MH OR OH 10 7 CL - ML ML OR OL 4 0 10 20 30 40 50 60 70 80 90 16 LIQUID LIMIT (LL) PLASTICITY CHART LL-PL = PI
ORGANICS • Soil having a high content of organic material is described as organic soil. • Organics are typically very compressible and has poor load-maintaining properties.
Why classify Soil ... purpose of a soil classification system is to be able to predict the engineering properties of the soil. WHAT SYSTEM DO WE USE?
Unified Soil Classification System The USCS looks at properties such as: • Percentages of gravel, sand, and fines. • Shape of the grain-size-distribution curve. • Plasticity and compressibility characteristics
Soil Classification gives a • good indication of … • Strength • Drainage • Resistance to Frost Action • Compressibility • (Volume Change) • Compaction • (Constructability)
USCS Letter Symbols Soils are divided into major groups and further subdivided by characteristics. Soil GroupsSoil Characteristics G Gravel W Well graded S Sand P Poorly graded M Silt H High compressibility C Clay L Low compressibility Pt Organic (Peat) O Organic (Silts and clays) L Liquid limit under 50 H Liquid limit over 50
USCS Soil Classification Chart Determine % Passing #200 If Less than 50 % of Coarse Fraction If 50 % or More of Total Sample If Less than 50 % of Total Sample If 50 % or More of Coarse Fraction Determine % Passing #4 It is a Gravel Plot Atterberg Test Data It is a Sand It is a Fine-grained Soil It is a Coarse-grained Soil Determine % Passing #200 Determine % Passing #200 Liquid Limit > 50 Liquid Limit < 50 If Less than 5% of Total Sample If Between 5% & 12% of Total Sample If Less than 5% of Total Sample If More than 12% of Total Sample If More than 12% of Total Sample If Between 5% & 12% of Total Sample Classify with Dual Symbol Determine Cu & Cc Plot Atterberg Test Data Classify with Dual Symbol Determine Cu & Cc Plot Atterberg Test Data Limits Plot in Hatched Area PI > 7 & Plots on or above A Line PI < 4 or Plots below A Line PI Plots on or above A Line PI Plots below A Line Determine Cu & Cc Cu > 6 & 1 < Cc < 3 Cu > 4 & 1 < Cc < 3 Determine Cu & Cc Classify as CL Classify as ML Classify as CL-ML Classify as CH Classify as MH Cu > 6 & 1 < Cc < 3 Cu > 4 & 1 < Cc < 3 YES YES NO NO Liquid Limit (oven dried) Liquid Limit (not dried) If < 0.75 Classify as SW Classify as SP Classify as GP Classify as GW Classify as OH Classify as OL Classify as SM Classify as SC Classify as SM-SC or ML or MH Fines CL or CH Fines CL-ML Fines Classify as GC Classify as GM Classify as GM-GC 60 YES NO NO YES 50 “A” LINE Plot Atterberg Test Data Plot Atterberg Test Data Plot Atterberg Test Data Plot Atterberg Test Data PI = 0.73 (LL - 20) CH OR OH 40 PLASTICITY INDEX (PI) 30 “U” LINE PI = 0.9 (LL - 8) ML or MH Fines CL-ML Fines CL or CH Fines ML or MH Fines CL-ML Fines CL-ML Fines ML or MH Fines ML or MH Fines CL or CH Fines CL-ML Fines CL or CH Fines CL or CH Fines 20 CL OR OL MH OR OH 10 Classify as GW-GM Classify as SW-SC 7 Classify as GW-GC Classify as GP-GM Classify as GP-GC Classify as SW-SM Classify as SP-SM Classify as SP-SC Classify as GW-GM-GC Classify as GP-GM-GC Classify as SW-SM-SC Classify as SP-SM-SC CL - ML ML OR OL 4 0 10 20 30 40 50 60 70 80 90 16 LIQUID LIMIT (LL) PLASTICITY CHART CL or CH Fines CL-ML Fines ML or MH Fines