Download
1 / 34
360 likes | 599 Views
Customer Service Definitions Elements of Customer Service Estimating the Benefits of Service Estimating the Costs of Service Determining Optimal Service Levels. Definitions of Customer Service.

E N D
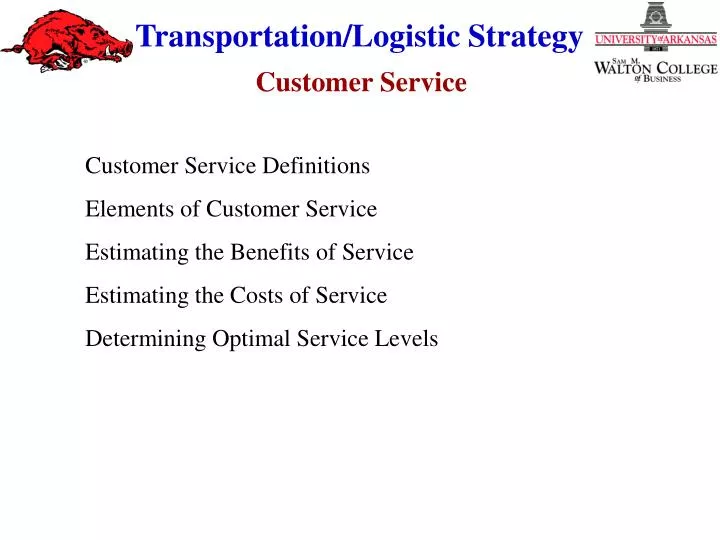
Customer Service Definitions Elements of Customer Service Estimating the Benefits of Service Estimating the Costs of Service Determining Optimal Service Levels
Definitions of Customer Service Elapsed Time Between the Receipt of an Order at the Warehouse and the Shipment of the Order from the Warehouse. Minimum Size of Order, or Limits on the Assortment of Items in an Order Which a Supplier Will Accept from Customers. Percentage of Items in a Supplier's Warehouse Which Might be Found to be Out-of-Stock at Any Given Point in Time. Proportion of Customer Orders Filled Accurately. Percentage of Orders Filled Within a Certain Time Period from Receipt of the Order at the Supplier's Warehouse. Percentage of Customer Orders Filled Completely Upon Receipt at a Supplier's Warehouse. Proportion of Goods Which Arrive at a Customers Place of Business in a Saleable Condition. Elapsed Time Between the Placement of an Order by a Customer and the Delivery of the Goods to the Customer. Ease and Flexibility with Which a Customer Can Place Orders.
Customer Service Definitions Elements of Customer Service Estimating the Benefits of Service Estimating the Costs of Service Determining Optimal Service Levels
Elements of Customer Service Cycle Time Dependability Convenience Communication
Cycle Time Approval Time Transmittal Time Processing Time Assembly Time Shipment Time Re-Stock Time
Order Cycle (Need Recognition to Need Fulfillment) Activities Unload/Re-Stock Time Order Requested Processing Time Transmittal Time Assembly Time Approval Time Need Fulfilled Delivery Time { { { { { { Order Sent to Warehouse Order Received In Office Order Shipped Replenishment Completed Order Delivered Need Recognized Order Sent to Supplier Events
Dependability Consistency Completeness Correctness Condition
Convenience Ease of Placing Orders Constraints on Order Sizes Constraints on Placement Times Who Arranges Transportation
Communication Easy Access to Empowered People No Surprises
Customer Service Definitions Elements of Customer Service Estimating the Benefits of Service Estimating the Costs of Service Determining Optimal Service Levels
$ Service Level Effects of Service Levels on Revenue Revenue
Estimating the Benefits of Service Quality Logistics Service as a Sales/Promotion Tool Methods of Estimation Questionnaires Historical Data Multiple Regression Analysis Example Important Issues
Estimating the Benefits of Service Quality An Example Sales = f (P, Adv, SF, Pro, OCT, VCT, BO, BOT, FR, IC, LD) Where: P = Price Adv = Advertising SF = Sales Force Pro = Other Promotions OCT = Order Cycle Time VCT = Variability in OCT BO = Back Orders BOT= Back Order Time FR = Fill Rate IC = Incorrect Shipments LD = Loss & Damage
Estimating the Benefits of Service Quality Logistics Service as a Sales/Promotion Tool Methods of Estimation Questionnaires Historical Data Multiple Regression Analysis Example Important Issues Non Linear Relationships Lagged Relationships Cumulative Effects
Revenue and Service Variables Variable Coefficient T-Ratio Constant3.95800.09 Price-1.1024-2.52 Pro (4mma,t-4)0.71821.88 OCT (5mma,t-5)0.95932.15 BOT (3mma,t-2)0.51152.00 Crd(3mma,t-2)0.13421.98 R2 = 71.4%; F=16.951; df = 34
Customer Service Definitions Elements of Customer Service Estimating the Benefits of Service Estimating the Costs of Service Determining Optimal Service Levels
Estimating the Cost of Service Quality Two Views as to the Cost of Service Quality: The Traditional Economic View of Service Quality Crosby’s View that Quality is Free
$ Cost of Service Service Level Estimating the Cost of Service Quality Traditional Economic View of Service Quality Costs Increase at an Increasing Rate
Estimating the Cost of Service Quality Crosby’s View that Quality is Free: Do it Right the First Time Costs are not Affected by Levels of Quality and May Perhaps Have a Positive Effect
Cost of Service if Quality is Free $ Cost of Service Service Level Estimating the Cost of Service Quality
$ Cost of Service Service Level Estimating the Cost of Service Quality Cost of Service if Quality has a Positive Effect
Estimating the Cost of Service Quality Which View is Correct? Traditional View vs Crosby? A Better Question is When is each View Correct? Physical Capacity vs Human Performance Measure Each Dimension of Service Quality Separately
Customer Service Definitions Elements of Customer Service Estimating the Benefits of Service Estimating the Costs of Service Determining Optimal Service Levels
Cost $ Revenue , Service Level Determining Optimal Service Levels Profit = Revenue - Cost
Profit Slope = Zero Slope Negative Slope Positive , Service Level Determining Optimal Service Levels Maximize Profit Where the Slope of the Profit Curve = Zero
p Profit = = Revenue - Cost p = Revenue - Cost .5 2.5 X X Revenue = -250 + 20 Cost = 500 + 4.76 Determining Optimal Service Levels (Fill-Rate Example)
p . . 5 2 5 X X = -250 + 20 - [500 + 4.76 ] p . . 5 2 5 X X = -250 + 20 - 500 - 4.76 X = 10/11.9 = .92 Determining Optimal Service Levels (Fill-Rate Example) and solve for X To maximize profit, set 1st derivative = zero
Previous Efforts: Ozmentand Chard (3M Company) AditiSen and Ozment (Holiday Inn) AhrenJohnston and Ozment (JB Hunt)
Ahren Johnston (JB Hunt) • Longitudinal data obtained directly from a national truckload motor carrier • Data set contained cost and service quality data on every order for nine months • Research focused on truckload, but data also was available for intermodal shipments • Was aggregated into daily observations for use in the analysis
Ahren Johnston (JB Hunt) H9:Total operating costs will be positively related to the physical dimension of service quality. H10:Total operating costs will be negatively related to the human performance dimension of service quality.
Motor Carrier Costs and Service C = f(X,W1,W2,W3,W4,Z1,Z2,Z3,Q1,Q2) Where: C =Total Cost of Operations X=Revenue Ton Miles W1=Price of Fuel W2=Price of Labor W3=Price of Capital W4=Price of Purchased Transportation Z1=Average Length of Haul Z2=Average Load per Vehicle Z3=Empty Mileage Q1=Physical Dimension of Quality Q2=Human Performance Dimension of Quality
Order Level Stop Level Variable Parameter Coefficient Significance Coefficient Significance Constant α -0.003 .000 -0.0034 .000 Y αY 0.499 .000 0.4995 .000 W1 β1 0.3697 .000 0.3697 .000 W2 β2 0.368 .000 0.368 .000 W3 β3 0.2561 .000 0.2561 .000 W4 β4 0.0063 .000 0.0063 .000 Z1 τ1 0.4933 .000 0.4932 .000 Z2 τ2 -0.517 .000 -0.5167 .000 Z3 τ3 -0.077 .000 -0.0776 .000 Q1 φ1 0.0646 0.083 0.1386 0.008 Q2 φ2 -0.068 .000 -0.0919 .000 Q1Q2 ψ12 5.5902 0.198 -1.6002 0.828