Download
1 / 45
470 likes | 710 Views
Osteoporosis Diagnosis by DEXA and Ultrasound Measurement. Dr. Suppasin Soontrapa Department of Orthopedics Khon Kaen University Khon Kaen Thailand 5 Mar 09. Diagnostic criteria of skeletal osteoporosis. By using bone densitometry to measure BMD and categorized the bone into 4 subgroups.

E N D
Osteoporosis Diagnosis by DEXA and Ultrasound Measurement Dr. Suppasin Soontrapa Department of Orthopedics Khon Kaen University Khon Kaen Thailand 5 Mar 09
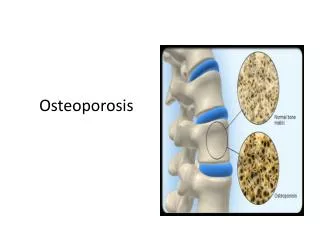
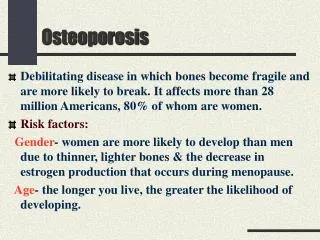
Diagnostic criteria of skeletal osteoporosis By using bone densitometry to measure BMD and categorized the bone into 4 subgroups 1. Normal 2. Low bone mass (osteopenia) 3. Osteoporosis 4. Severe osteoporosis WHO 1994
Dual Energy X-Ray Absorptiometry (DEXA) • Precision errors 1%-2% • DPX-IQ, Lunar Corp, USA
Average BMD in each age group Peak bone mass (young adult reference mean)
85% NORMAL Normal : BMD within 1 SD of the young adult reference mean (T-score> -1)
Low bone mass (osteopenia) : BMD <-1 SD of the young adult mean but > -2.5 SD (-1< T-score>-2.5) 85% NORMAL 14.4% OSTEOPENIA
Osteoporosis : BMD < -2.5 SD (T-score<-2.5) 85% NORMAL 14.4% OSTEOPENIA 0.6% OSTEOPOROSIS
Guideline for diagnosing osteoporosis in Asia E.M.C. Lau, et al. APLAR Journal of Rheumatology 2006
Indications for BMD measurement • NOF recommends DXA measurement • The elderly women age > 65 yrs • Postmenopausal women with previous history of fracture
NOF recommends DXA measurement • Postmenopausal women age< 65 yrs and with > 1 additional risk factors for osteoporosis • Parental history of hip fracture • Current cigarette smoking • BMI <19 (for Asian women) • Use of (or plan to use) oral corticosteroids for longer than 3 months • Serious long-term conditions thought to increase fracture risk, such as hyperthyroidism or malabsorption
A Simple Tool to Identify Asian Women at Increased Risk of Osteoporosis L.K.H. Koh et al. Osteoporos Int (2001) 12:699-705 Osteoporosis Self Assessment Tool for Asians (OSTA) Research Group
OSTA index Integer of (0.2 X (weight – age)) Wt=40, age = 70 OSTA index = -6
Compared OSTA index with BMD of femoral neck • By using OSTA index with cutoff value of -1 vs. Femoral neck BMD T-score < -2.5 • Sensitivity 91% • Specificity 45% • PPV 20.88% • NPV 96.85%
Quantitative Ultrasound (QUS) Heel QUS using a gel-coupled bone sonometer Achillis Express (GE-Lunar, Madison, USA)
Quantitative Ultrasound (QUS) • Advantages • Low cost • Portability • No radiation • Easy to use
Quantitative Ultrasound (QUS) • Many studies showed QUS had low sensitivity and high specificity • Suthee Panichkul, et al., (Phramongkutklao hospital) Obstet. Gynaecol. 2004 • +QUS of the calcaneus (SI*) vs. femoral neck BMD (using WHO criteria: T-score < -2.5) • Sensitivity = 39.25% • Specificity = 91.71% • PPV = 72.41% • NPV = 73.14% SI (stiffness index)=([0.67xBUA]+[0.28xSOS]-420) +Achillis express (Lunar, Madison, USA) *SI = stiffness index
Quantitative Ultrasound (QUS) • Many studies showed QUS had low sensitivity and high specificity • Vasi Naganathan, et al., (Royal North Shore hospital, Sydney) MJA 1999 • QUS of the calcaneus (BUA, VOS) vs. lumbar spine & femoral neck BMD (using WHO criteria: T-score < -2.5) • Sensitivity = 9%- 47% depending on the QUS parameters • Specificity = 88% - 100%depending on the QUS parameters BUA = Board band ultrasound attenuation VOS =velocity of sound CUBA Mark II (McCue Ultrasonics, London, UK)
The combination of OSTA index and quantitative ultrasound to increase the efficacy and decrease the cost in diagnosis of osteoporosis Dr.Suppasin Soontrapa, et al. Srinagarind Hospital Khon Kaen University Khon Kaen Thailand
Research question • Could sequential method of investigation (OSTA+QUS) has diagnostic power on osteoporosis vs. gold standard DXA
Objective • To evaluate the efficacy of the combination of OSTA index and QUS in diagnosing osteoporosis in Thai elderly
Methods • First step • Screening the participants by using OSTA index cutoff value of < -1 (sen 91%) • Second step • Measuring all participants who had OSTA index < -1 by QUS (Achillis express®) (spec ~ 90%) and DXA • Comparing the T-score of QUS with T-score of DXA
Results • Total one hundred elderly women with OSTA index < -1 were enrolled • Average age = 69.97 yrs (age range 60-89 yrs) • Average weight = 49.24 kg (weight range 30-81 kg) • Average BMI = 22.51 Kg/m2 (range 15.75-35.06) • BMI<19 = 19 cases • BMI > 19 = 81 cases
Correlation between 1st and 2nd measurement of 1st observer r=0.973 p<0.001
Correlation between 1st and 2nd measurement of 2nd observer r=0.976 p<0.001
Correlation of the measurement between 1st and 2nd observers r=0.925 p<0.001
Reliability or agreement of measurement • Continuous value • Limits of agreement of measurement • X axis = mean of measurement • Y axis = difference of measurement • Test for significant difference • One sample t-test with zero value • Significant difference when p-value<0.05
Mean = SI 1+ SI 2 2 Diff_SI = SI1 – SI2
Limit agreement of SI between 1st and 2nd measurement of 1st observer One sample t-test test value =0 P-value =0.765 Mean diff. = 0.12 SD = 4 SI = stiffness index
Limit agreement of SI between 1st and 2nd measurement of 2nd observer Limit agreement of SI between 1st and 2nd observer One sample t-test test value =0 P-value =1 Mean diff. = 0.00 SD = 3.79
Limit agreement of SI between 1st and 2nd observer One sample t-test test value =0 P-value =0.904 Mean diff. = -0.08 SD = 6.63
conclusion • Correlation coefficient (r) of both intra and interobserver showed strong correlation (>0.9) • Limits of agreement of both intra and interobserver showed no any significant difference from zero • QUS has good reliability, reproducibility and easy to use
Diagnostic characteristic of OSTA + QUS vs. BMD of spine L1-4(T-score < -2.5)
Diagnostic characteristic of OSTA + QUS vs. BMD of femoral neck(T-score < -2.5)
Diagnostic characteristic of OSTA + QUS vs. BMD of total femur(T-score < -2.5)
Diagnostic characteristic of QUS T-score < -4.5 VS BMD of spine and hip
WHO criteria (1994) No specific site WHO task force for Osteoporosis (1999) Femoral neck IOF (International Osteoporosis Foundation) year 2000 Total hip Site Of Measurement of DXA for osteoporosis diagnosis
Conclusion • OSTA index <-1 and QUS T-score <-4.5 performed well in diagnosis of osteoporosis (accuracy 80%-89% for hip BMD) • Convenience to use • Portability • Cost effective