Download
1 / 25
250 likes | 311 Views
Energy Management : : 2011/12. Class # 1 Course organization Sustainability and resource management Prof. Paulo Ferrão ferrao@ist.utl.pt. Human development and resource productivity. 100. 90. Environment. 80. Labor. Capital. 70. 60. Importância relativa. 50. 40. 30. 20. 10. 0.

E N D
Energy Management :: 2011/12 Class # 1 Course organization Sustainability and resource management Prof. Paulo Ferrão ferrao@ist.utl.pt
Human development and resource productivity 100 90 Environment 80 Labor Capital 70 60 Importância relativa 50 40 30 20 10 0 0 500 1000 1500 Ano
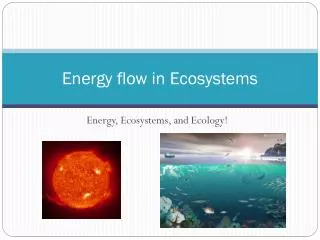
Energy Nutrients Natural Ecosystem Consumenrs Producers Nutrients reservoir Decomposers
Human development and resource productivity 100 90 Environment 80 Labor Capital 70 60 Importância relativa 50 40 30 20 10 0 0 500 1000 1500 Ano
Human development and resource productivity 100 90 Environment 80 Labor Capital 70 60 Importância relativa 50 40 30 20 10 0 0 500 1000 1500 2000 Ano
Human development and resource productivity 100 90 Environment 80 Labor Capital 70 60 Unemployment and overexploitation of environment are factors that determin the major relevance of the Productivitity of Natural Resources Importância relativa 50 40 30 20 10 0 0 500 1000 1500 2000 Ano
Business-as-usual Compliance with regulation Pollution prevention Process oriented EIA, Energy audits, Envir. audits Extended product responsability Eco-efficiency Design for Environment Life Cycle Assessment Product oriented LCA • Historical pattern of Environmental Strategies Time and Space Historical pattern of Environmental strategies
Resources Resources • Life cycle thinking MSW EEE Car Components Manufacturing Assembly Use Waste Environment
Others Product Life Cycle Space MSW EEE Car Components Manufacturing Assembly Use Resources Waste • Life cycle thinking Environment
Time and Space Historical pattern of Environmental strategies Business-as-usual Compliance with regulation Pollution prevention Process oriented EIA, Energy audits, Envir. audits Extended product responsability Eco-efficiency Design for Environment Life Cycle Assessment Product oriented LCA IndustrialEcology Creating loop closing industrial ecosystems Promoting waste exchanges Cascading energy utilization Systems Oriented • Historical pattern of Environmental Strategies
MSW Bulk- MFA SFA LCA MFA Resources Landfill Incineration I.E. Tech. Shredder Others Product Life Cycle Space TOOLS EEE Car Components Manufacturing Assembly Use Recycling
ECONOMY METABOLISM Energy Nutrients Natural Ecosystem Consumenrs Producers Nutrients reservoir Decomposers
TMR DMI Stocks Economy Materials Flow Analysis Air Water Air Water Foreign hidden flows Imports Exports Domestic extraction Domestic output Environmentalburdens Domestic hidden flows ENVIRONMENT * Matthews et al. (2000)
Adapted from Bringezu and Schütz, 2000, Total Material Requirement of the European Union, European Environment Agency, Technical report No 55. Portugal in the European Context (1988-1997)
A new Kuznets Curve ? Canas, A., Ferrão, P. and Conceição, P. (2003) “A new environmental kuznets curve? Relationship between direct material input and income per capita: evidence from industrialized countries”. Ecological Economics. Volume 46, Issue 2, September 2003 , Pages 217-229.
Ecological Footprint The ECOLOGICAL FOOTPRINT is a resource management tool that measures how much land and water area a human population requires to produce the resources it consumes and to absorb its wastes under prevailing technology. • The Ecological Footprint, human demand, and biocapacity, ecosystem supply, are both measured in units of global hectares, a hectare normalized to the average productivity of all bioproductive hectares on Earth. • As of 2003, there are approximately 11.2 billion global hectares of area available. In that same year, humanity demanded products and services from the equivalent of 14.1 billion global hectares. • Excel file Available in: http://www.footprintnetwork.org
Ecological Footprint Available in: http://www.footprintnetwork.org
Ecological Footprint Available in: http://www.footprintnetwork.org
Energy transformation SankeyDiagramm • Energy Transformation: • Dams, thermalpowerstations, windmills, ... • Refineries, … • Fuel transport, electricitynetworks, … Primary energy Supply PRODUCTION EFFICIENCY • Energy Conversion: • Internalcombustionengines, ... • Lamps, … • Heaters, … Final energy ENERGY EFFICIENCY • Energy Use: • Products, ... • Confort, … • Transportation, … Demand Useful energy CONTROL & BEHAVIOR Productive energy
E G 1 D B 4 A 6 2 9 10 11 5 C 7 3 8 12 F Block diagram EXAMPLE
Energy systems analysis PROBLEM 01 – Complex system (recycling + treatment) Consider the following system, and determine the matrix of flow relations. Recycling J I 13 12 14 Treatment K H Waste 10 11 F G Energy 16 8 9 7 15 D E Final A B C 5 6 1 2 3 4
Sales Transaction table beetween sectors Total Output Final demand IO model - Leontief • Idea developed by W. Leontief (Nobel prize in economics in 70’s) • Part of National Income and Product Accounts • Total Inputs = Total Outputs $ x11 + x12 + x13 + … + x1n + y1 = x1 x21 + x22 + x23 + … + x2n + y2 = x2 x31 + x32 + x33 + … + x3n + y3 = x3 ……………………………………. xn1 + xn2 + xn3 + … + xnn + y3 = xn