Download
1 / 14
140 likes | 141 Views
Learn about cost curves, including basic concepts, cost minimizing input choice, cost curves, short-run and long-run costs, and shifts in cost curves. Understand how to maximize profit through cost analysis.

E N D
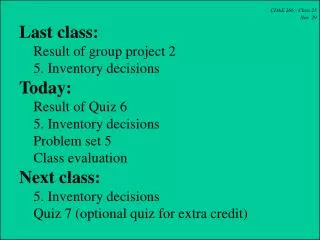
CDAE 254 - Class 20 Nov. 1 • Last class: • Problem set 5 • 6. Costs • Quiz 5 • Today: • Result of Quiz 5 • 6. Costs • Next class: • 7. Profit maximization and supply • Quiz 6 (Chapter 6) • Important date: • Problem set 5: due today
Result of Quiz 5 N = 55 Range = 3 – 10 Average = 7.8
6. Costs 6.1. Basic concepts of costs 6.2. Cost minimizing input choice 6.3. Cost curves 6.4. Short-run and long-run costs 6.5. Per unit short-run cost curves 6.6. Shifts in cost curves 6.7. An example 6.8. Applications
6.3. Cost curves 6.3.1. Possible shapes of the total cost curve (function): relation between TC and q (Fig. 6.3) (1) Constant returns to scale (2) Decreasing returns to scale (3) Increasing returns to scale (4) Optimal scale: increasing returns to scale followed by decreasing returns to scale A practice question: If TC=50 for Q=20 and TC=90 for Q=40, what is the returns to scale of this production?
6.3. Cost curves 6.3.2. Average cost (AC) & marginal cost (MC) (1) What is the AC and what is the MC? AC = TC/q MC = ΔTC/Δq (2) AC & MC curves (functions) (Fig. 6.4) (a) Constant returns to scale (b) Decreasing returns to scale (c) Increasing returns to scale (d) Optimal scale A practice question: If MC<AC, what is the returns to scale?
6.3. Cost curves 6.3.2. Average cost and marginal cost (3) Optimal scale: Relationship between AC and MC (4) Optimal scale: Lowest AC input choice When MC < AC, AC is decreasing When MC > AC, AC is increasing When MC = AC, AC is at the minimum level.
6.4. Short run and long run costs 6.4.1. Very short run, short run & long run Very short run: K and L are fixed Q is also fixed Short run: K is fixed and L change Q can change Long run: both K and L can change Q can change 6.4.2. Input flexibility in the short-run and long run (Fig. 6.5) Short run: K is fixed and L can change Long run: both K and L can change
6.4. Short run and long run costs 6.4.3. Short-run total costs: STC = vK* + wL = SFC + SVC 6.4.4. Short-run fixed, variable & total cost curves Note that the concept “returns to scale” does not apply in the short run.
6.5. Per-unit short run cost curves 6.5.1. Short-run average cost: SAC = STC / q 6.5.2. Short-run marginal cost SMC = ΔSTC/Δq 6.5.3. SAC and SMC curves 6.5.4. Long-run average cost & marginal cost 6.5.5. Relationship between short-run and long-run cost curves 6.5.6. An example: choosing an ink-jet printer or laser printer Ink-jet: STC = 80 + 0.07 q Laser: STC = 200 + 0.04 q
6.6. Shifts in cost curves 6.6.1. Change in input prices (w and v) (1) w & v change in the same proportion -- TC, AC and MC will change -- Expansion path will not change (2) w & v change in difference proportions -- TC, AC and MC will change -- Expansion path will change
6.6. Shifts in cost curves 6.6.2. Technology change -- TC, AC and MC will change -- Expansion path?
6.7. An example (continued from chapter 5) -- Production function -- Total cost TC = vK + wL= 5K + 5L -- Isoquant of q = 40 -- Total cost of producing 40 units of q -- Cost-minimizing input choice for q=40 L* = 4 and K* = 4, TC = 40 -- Long-run expansion path & costs -- Short-run total cost (STC), short-run average cost (SAC) and short-run marginal cost (SMC)
6.7. An example (continued from chapter 5) -- Comparison of short-run & long-run costs