Download
1 / 34
340 likes | 467 Views
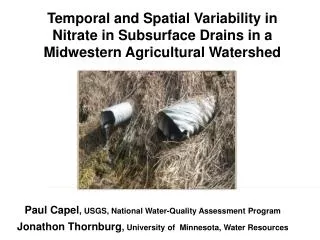
Monitoring and Assessing Watershed Contributions of Sediment and Phosphorus to the Lower Fox River and Green Bay. Kevin Fermanich, UWGB Paul Baumgart, UWGB Dave Graczyk, USGS Jessie Fink, UWGB (JJR). State of Lake Michigan Conference Green Bay, WI – November 3, 2005.

E N D
Monitoring and Assessing Watershed Contributions of Sediment and Phosphorus to the Lower Fox River and Green Bay Kevin Fermanich, UWGBPaul Baumgart, UWGBDave Graczyk, USGSJessie Fink, UWGB (JJR) State of Lake Michigan Conference Green Bay, WI – November 3, 2005
#1 trib. to Lake Michigan and #3 to Great Lakes (6,400 mi2) Large source of pollutants P Loads: ~560,000 kg/yr ~80% from runoff Lower Fox Basin ¼ P ½ TSS Mouth New London DePere Wrightstown Oshkosh Appleton Berlin Neenah/Menasha Fox-Wolf Basin:
Watershed background: Soil Permeability • Clay soils
Watershed background? • Cows • Construction • P
Lower Fox River Subbasin: Why Here? Estimated sediment yield Sediment Yield~ 0.25 mt/ha to Bay (Baumgart, 2000; SWAT modeling)
How much? Where? What forms? Driving Factors? Impacts? Long-term Trends? What if? Basic Questions
Major Program Elements(began 2003) • Continuous monitoring • Sediment & P loading (3 WY) • Real-time sensors • Source area studies • Watershed modeling • Stream biotic integrity monitoring • School-based monitoring program • hands-on learning, citizen scientists, meaningful data
Program Partners • UW-Green Bay • Natural and Applied Sciences • Cofrin Center for Biodiversity • UW-Milwaukee • US Geological Survey • GBMSD • Oneida Tribe • 5 High Schools • Arjo Wiggins Appleton, Inc. www.uwgb.edu/watershed
How much? Where? What forms? Driving Factors? Impacts? Long-term Trends? What if? This presentation:
Monitoring Stations • 3 water years started Oct ‘03 • Watersheds • Duck Creek • Baird Creek • Apple Creek • Ashwaubenon Creek • East River (GBMSD)
Methods • Daily stage / flow • Low-flow / baseflow samples • Event Samplers • (~10 runoff events/year) • Total P, TSS • Total Dissolved P (25%) • TSS correlation with SSC • Precip. gauge network • Compute daily TP and sed. loads, and estimate DP loads
Results • Precipitation • Box plots of Concentration Data • DP/TP ratios • Loads and Yields (WY2004) • Urbanization sources
Precipitation WY 2004 = 813 mm NWS 30 yr = 741 mm WY 2005 = 719 mm
1988-2001 LFB median TSS (mg/L): All Samples
1988-2001 LFB median TP (mg/L): All Samples
4 days 46% TSS 39% P 2 days 31% TSS 25% P 6 days 63% TSS 49% P
Sediment and P Yields, WY04 • ~0.75 mton/ha in clay soils watersheds (2000 land use SWAT modeling = 0.25 mton/ha).
Conclusions:Tributary Monitoring • WY04 2nd wettest May on record; annual only +10% • WY05 annual= -3%; few runoff events • Apple, Ash., Baird similar median TSS conc. (~180 mg/L) – 2.5x previous studies • WY05: ½ of conc. of 2004 • TP median conc. 0.28 – 0.70 mg/L (10-20% lower in WY05) • 25% of Ash. Creek samples > 0.93 mg/L • TP > 2 mg/L at all sites
Conclusions:Tributary Monitoring • DP 40 to 54% of TP during events • DP significant form of runoff P. • Implications for BMPs? • Loads highly event driven • 8 days (5 events): 55% of annual P & 71% of TSS load in Apple Creek in WY04 • High sediment (0.7-.93 t/ha) and P (~2 kg/ha) yields in WY04 from Apple, Ash., Baird.
Baird Creek Urbanization Study • Determine what impact the transition from ag. to urban land use is having on Baird Creek • Sediment and phosphorus conc. & loads • Evaluate stream morphology
2004 Land Use Projected 2022 Areas of active construction
Summer 2004 Event Conc. Total P Sediment
South vs. North Branches • 60-70% of Sediment Load • <20% of area
Summary • Are conditions improving? • Can we deal with big events at source areas? • Ag and urban • Can we deal with dissolved P? Further analysis of watershed linkages and biotic integrity are ongoing.
Acknowledgements • Dale Robertson, Paul Reneau and Troy Rutter, U.S. Geological Survey • John Kennedy and Tracy Valenta, GBMSD • Tim Ehlinger and crew UW Milwaukee • Bud Harris, UWGB • Jon Habeck, Jessie Baumann, Nick Reckinger, UWGB • Arjo Wiggins Appleton, Inc.
www.uwgb.edu/watershed Satellite image May 19, 2000