Download
1 / 1
20 likes | 117 Views
12x10. 4. total phytoplankton. 10x10. 4. 20:1. 15:1. 10:1. 8x10. 4. 5:1. 6x10. 4. 4x10. 4. 2x10. 4. 0. 0. 1. 2. 3. 4. 5. 6. 7. 8. 9. 10. 3.0. 120. 100. 80. 2.0. 60. 40. 1.0. 20. 0. 0.0. 5. 10. 15. 20. 5. 10. 15. 20. no prey. no prey. initial. 10.

E N D
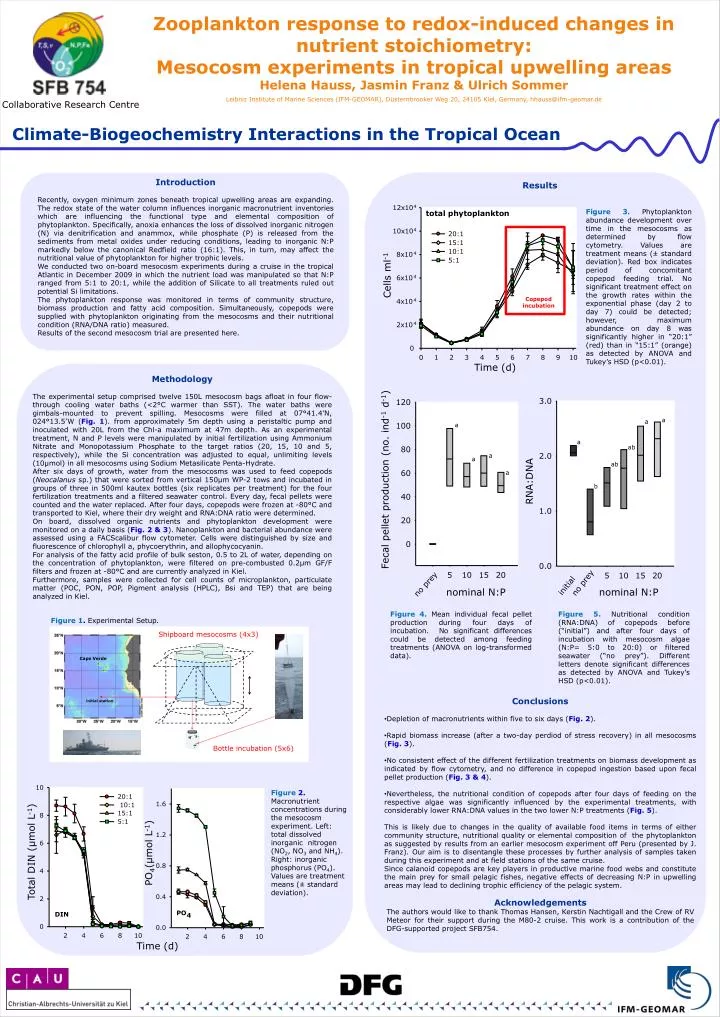
12x10 4 total phytoplankton 10x10 4 20:1 15:1 10:1 8x10 4 5:1 6x10 4 4x10 4 2x10 4 0 0 1 2 3 4 5 6 7 8 9 10 3.0 120 100 80 2.0 60 40 1.0 20 0 0.0 5 10 15 20 5 10 15 20 no prey no prey initial 10 20:1 1.6 10:1 15:1 8 5:1 1.2 6 0.8 4 0.4 2 PO DIN 4 0 0.0 2 4 6 8 10 2 4 6 8 10 Zooplankton response to redox-induced changes in nutrient stoichiometry: Mesocosm experiments in tropical upwelling areas Helena Hauss, Jasmin Franz & Ulrich Sommer Leibniz Institute of Marine Sciences (IFM-GEOMAR), Düsternbrooker Weg 20, 24105 Kiel, Germany, hhauss@ifm-geomar.de Collaborative Research Centre Climate-Biogeochemistry Interactions in the Tropical Ocean Introduction Recently, oxygen minimum zones beneath tropical upwelling areas are expanding. The redox state of the water column influences inorganic macronutrient inventories which are influencing the functional type and elemental composition of phytoplankton. Specifically, anoxia enhances the loss of dissolved inorganic nitrogen (N) via denitrification and anammox, while phosphate (P) is released from the sediments from metal oxides under reducing conditions, leading to inorganic N:P markedly below the canonical Redfield ratio (16:1). This, in turn, may affect the nutritional value of phytoplankton for higher trophic levels. We conducted two on-board mesocosm experiments during a cruise in the tropical Atlantic in December 2009 in which the nutrient load was manipulated so that N:P ranged from 5:1 to 20:1, while the addition of Silicate to all treatments ruled out potential Si limitations. The phytoplankton response was monitored in terms of community structure, biomass production and fatty acid composition. Simultaneously, copepods weresupplied with phytoplankton originating from the mesocosms and their nutritional condition (RNA/DNA ratio) measured. Results of the second mesocosm trial are presented here. Results Figure 3. Phytoplankton abundance development over time in the mesocosms as determined by flow cytometry. Values are treatment means (± standard deviation). Red box indicates period of concomitant copepod feeding trial. No significant treatment effect on the growth rates within the exponential phase (day 2 to day 7) could be detected; however, maximum abundance on day 8 was significantly higher in “20:1” (red) than in “15:1” (orange) as detected by ANOVA and Tukey’s HSD (p<0.01). Cells ml-1 Copepod incubation Time (d) Methodology The experimental setup comprised twelve 150L mesocosm bags afloat in four flow-through cooling water baths (<2°C warmer than SST). The water baths were gimbals-mounted to prevent spilling. Mesocosms were filled at 07°41.4’N, 024°13.5’W (Fig. 1). from approximately 5m depth using a peristaltic pump and inoculated with 20L from the Chl-a maximum at 47m depth. As an experimental treatment, N and P levels were manipulated by initial fertilization using Ammonium Nitrate and Monopotassium Phosphate to the target ratios (20, 15, 10 and 5, respectively), while the Si concentration was adjusted to equal, unlimiting levels (10µmol) in all mesocosms using Sodium Metasilicate Penta-Hydrate. After six days of growth, water from the mesocosms was used to feed copepods (Neocalanus sp.) that were sorted from vertical 150µm WP-2 tows and incubated in groups of three in 500ml kautex bottles (six replicates per treatment) for the four fertilization treatments and a filtered seawater control. Every day, fecal pellets were counted and the water replaced. After four days, copepods were frozen at -80°C and transported to Kiel, where their dry weight and RNA:DNA ratio were determined. On board, dissolved organic nutrients and phytoplankton development were monitored on a daily basis (Fig. 2 & 3). Nanoplankton and bacterial abundance were assessed using a FACScalibur flow cytometer. Cells were distinguished by size and fluorescence of chlorophyll a, phycoerythrin, and allophycocyanin. For analysis of the fatty acid profile of bulk seston, 0.5 to 2L of water, depending on the concentration of phytoplankton, were filtered on pre-combusted 0.2µm GF/F filters and frozen at -80°C and are currently analyzed in Kiel. Furthermore, samples were collected for cell counts of microplankton, particulate matter (POC, PON, POP, Pigment analysis (HPLC), Bsi and TEP) that are being analyzed in Kiel. a a a a ab a a ab a Fecal pellet production (no. ind-1 d-1) RNA:DNA b nominal N:P nominal N:P Figure 4. Mean individual fecal pellet production during four days of incubation. No significant differences could be detected among feeding treatments (ANOVA on log-transformed data). Figure 5. Nutritional condition (RNA:DNA) of copepods before (“initial”) and after four days of incubation with mesocosm algae (N:P= 5:0 to 20:0) or filtered seawater (“no prey”). Different letters denote significant differences as detected by ANOVA and Tukey’s HSD (p<0.01). Figure 1. Experimental Setup. Shipboard mesocosms (4x3) Cape Verde • Conclusions • Depletion of macronutrients within five to six days (Fig. 2). • Rapid biomass increase (after a two-day perdiod of stress recovery) in all mesocosms (Fig. 3). • No consistent effect of the different fertilization treatments on biomass development as indicated by flow cytometry, and no difference in copepod ingestion based upon fecal pellet production (Fig. 3 & 4). • Nevertheless, the nutritional condition of copepods after four days of feeding on the respective algae was significantly influenced by the experimental treatments, with considerably lower RNA:DNA values in the two lower N:P treatments (Fig. 5). • This is likely due to changes in the quality of available food items in terms of either community structure, nutritional quality or elemental composition of the phytoplankton as suggested by results from an earlier mesocosm experiment off Peru (presented by J. Franz). Our aim is to disentangle these processes by further analysis of samples taken during this experiment and at field stations of the same cruise. • Since calanoid copepods are key players in productive marine food webs and constitute the main prey for small pelagic fishes, negative effects of decreasing N:P in upwelling areas may lead to declining trophic efficiency of the pelagic system. initial station Bottle incubation (5x6) Figure 2. Macronutrient concentrations during the mesocosm experiment. Left: total dissolved inorganic nitrogen (NO2, NO3 and NH4). Right: inorganic phosphorus (PO4). Values are treatment means (± standard deviation). PO4(µmol L-1) Total DIN (µmol L-1) Acknowledgements The authors would like to thank Thomas Hansen, Kerstin Nachtigall and the Crew of RV Meteor for their support during the M80-2 cruise. This work is a contribution of the DFG-supported project SFB754. Time (d)