Download
1 / 18
180 likes | 276 Views
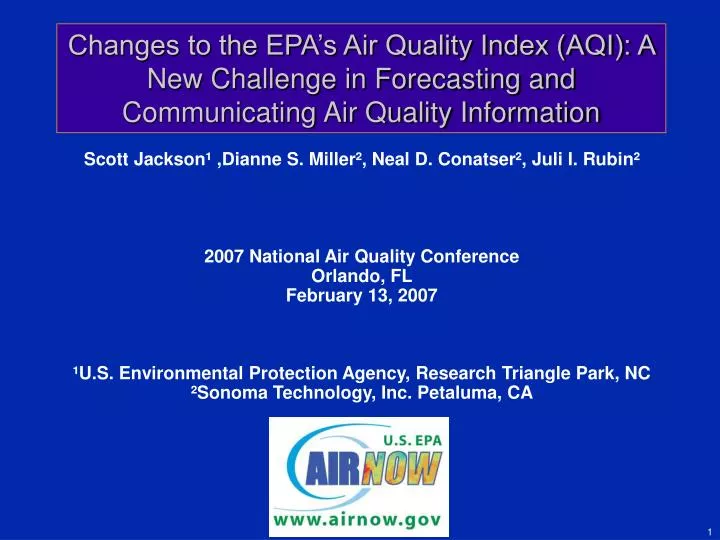
Changes to the EPA’s Air Quality Index (AQI): A New Challenge in Forecasting and Communicating Air Quality Information. Scott Jackson ¹ ,Dianne S. Miller ² , Neal D. Conatser ² , Juli I. Rubin ² 2007 National Air Quality Conference Orlando, FL February 13, 2007

E N D
Changes to the EPA’s Air Quality Index (AQI): A New Challenge in Forecasting and Communicating Air Quality Information • Scott Jackson¹ ,Dianne S. Miller², Neal D. Conatser², Juli I. Rubin² • 2007 National Air Quality Conference • Orlando, FL • February 13, 2007 • ¹U.S. Environmental Protection Agency, Research Triangle Park, NC • ²Sonoma Technology, Inc. Petaluma, CA
Acknowledgements • Analysis performed by Sonoma Technology Incorporated under EPA Work Assignment 3-13 • Findings are preliminary. • Final report due due in mid-March 2007.
Background • EPA lowered the PM2.5 24-hr standard from 65 µg/m3 to 35 µg/m3 to protect public health. • EPA is assessing whether to lower the thresholds for the following PM2.5 AQI categories: – Unhealthy for Sensitive Groups (USG) – Unhealthy – Very Unhealthy – Hazardous • Affects • Local agencies (forecasting, outreach) • Existing agencies and new agencies • AIRNow program
How does it affect us? • Additional days considered unhealthy • More effort needed (outreach, forecasting) • More close-call days • Questions from public/media • July 2006 in Detroit Potential New AQI Current AQI
Questions addressed • How many more USG days should we expect each year and each season? • Will episodes (USG+) be longer? • During summer, are more USG days dominated by ozone or PM2.5? • Can USG occur with different meteorology conditions? • What cities might need to begin forecasting due to the potential AQI thresholds?
Data used (1 of 2) • Period: 2003-2005 data • Source: AQS • Data types: Continuous and FRM • Locations: Forecast cities in AIRNow (AQS continuous data) • Other cities (AQS FRM data) • Metric: 24-hour averaged values • Some considerations: • 75% data completeness • Continuous data useful because available in real-time for forecasting and outreach • Continuous data in AQS may not match the FRM-like data submitted to AIRNow • Examined Forecast cities in AIRNow and core-based statistical areas (CBSA) • Frequency of collection of FRM data varied from daily to every sixth day
(159 cities) (33 cities) (104 cities) Data used (2 of 2) AQS PM2.5 data completeness for forecast cities in AIRNow
How many more USG days should we expect each year and each season? (1 of 2) Average increase in USG days per year • Many (70) cities will have at least twice as many USG days per year under the potential new AQI thresholds • Nearly all cities (141) will have at least a 50% increase in the number of USG days per year • Examples: • – Boston: 5 to 9 days – Atlanta: 9 to 16 • – Detroit: 34 to 54 days – Denver: 2 to 3 • – Tacoma: 3 to 9 days
Summer: Jun – Aug Spring: Mar - May Winter: Dec – Feb Fall: Sep – Nov How many more USG days should we expect each year and each season? (2 of 2) Peak PM2.5 season may change for many cities – Chicago: winter to summer – Terre Haute: summer to fall
Current AQI – July 2005 Potential AQI – July 2005 Will episodes (USG+) be longer? • Average number of three or more day episodes per year Detroit • Multi-day high PM2.5 events will become more frequent Annual Episodes
During summer, will more USG days be dominated by ozone or PM2.5? Dominant pollutant at current and potential new USG threshold, May-September Many cities that previously had the majority of their USG days dominated by ozone will now have the majority of their USG days dominated by PM2.5
Can USG Levels Occur With Different Meteorology? • Lower criteria for USG may result in different meteorological conditions conducive for USG levels • This could impact existing forecast tools • Conceptual models for USG levels • Synoptic and local weather • Transport • Classification and Regression Trees • Conducted limited case study and statistical analyses
Conceptual Findings - Example(1 of 2) • Richmond, Virginia, for 2004 and 2005 • 8 USG days under current USG threshold • 16 USG days under potential new USG threshold • Occurred in summer only • Limited analysis showed that the additional USG days can occur under a transient short-wave ridge • These transient meteorological events were not common on days in which PM2.5 levels were greater than 40.5 ug/m3
Movement Richmond, Virgina Trough Ridge Conceptual Findings - Example(2 of 2) 500 mb height contours at 7:00 a.m. EST, July 21, 2005. Richmond’s PM2.5 concentration was 36 µg/m3.
Statistical Findings - Example • Louisville, Kentucky, for 2003 through 2005 • 12 USG days under current USG threshold with meteorological data • 22 USG days under potential new USG threshold with meteorological data • Higher daily average wind speed on additional 10 days • 2.6 knots for current USG days • 3.0 knots for additional USG days • Similar temperature and relative humidity between current and additional USG days
What cities might want to consider forecasting due to the potential AQI thresholds?
Summary • Change in AQI threshold will likely cause: • Most cities to have at least a 50% increase in USG days observed per year due to PM2.5 • A shift from an ozone-dominated summer season to a PM2.5-dominated summer season for about 20% of the cities • PM2.5 USG days in cities that have not had any in the past • PM2.5 USG days for additional seasons in many cities • A different peak PM2.5 season in some cities • PM2.5 USG days to occur under new meteorological conditions • Want to know the details about your city? • Handouts are available with city-specific statistics