Download
1 / 14
140 likes | 241 Views
Risk-Adjusted Performance and Informed Decision Making. Dr. Arun Muralidhar. www.mcubeit.com. Arun Muralidhar - Bio. Chairman of Mcube Investment Technologies, LLC and Managing Director at FX Concepts, Inc.

E N D
Risk-Adjusted Performance and Informed Decision Making Dr. Arun Muralidhar www.mcubeit.com
Arun Muralidhar - Bio • Chairman of Mcube Investment Technologies, LLC and Managing Director at FX Concepts, Inc. • Head of Investment Research and Member of Investment Management Committee, World Bank Investment Department, 1995-1999 • Derivatives and Liability Management, World Bank Funding Department, 1992-1995 • Managing Director and Head of Currency Research, JPMIM, 1999-2001 • BA, Wabash College (1988); PhD, MIT Sloan (1992)
Agenda • Background • Why the information ratio is wrong – M2 • Risk budgeting – connecting returns to risk – M3 • Confidence in skill: History matters - SHARAD • Optimal portfolio construction using these measures
Relative Risk – Tracking Error • Most commonly used measure • Ann. standard deviation of excess returns • Depends on the standard deviation of the benchmark, strategy and correlation • Few test ex-ante forecast with ex-post outcomes • Papers that recommend that managers stay within tracking error ranges are WRONG
Performance Measures • Returns – Absolute and Relative • Annualized versus Cumulative • Ratios – Risk-Adjusted • Sharpe, Information Ratio, Sortino Ratio • Risk-Adjusted Returns • M2, M3, SHARAD • Skill Measures
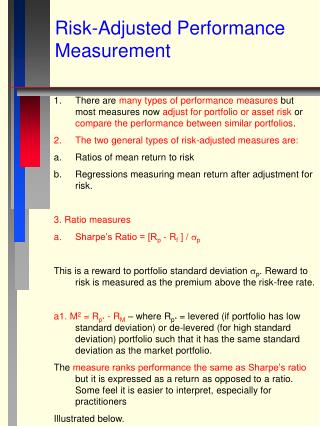
How to Calculate Standard Measures? • Unadjusted measures • Excess return = Portfolio return - Benchmark return • Risk-adjusted ratio measures • Sharpe ratio = Excess over risk free rate/standard deviation of portfolio • higher the ratio, the better the investment opportunity • Information ratio = Excess over benchmark/standard deviation of excess returns • higher the ratio, better the manager
Some Advanced Risk-Adjusted Measures • Sortino ratio = Excess/Downside risk measure • Risk-adjusted measures (in return terms) • M2 = extended Sharpe ratio (in basis points) • M3 = extended M2 ratio; corrects for correlation • SHARAD = Normalizes for different length of history • Confidence in Skill – Tells how confident one can be that there is skill (as opposed to noise) in a given track record
Information Ratio is Wrong - M2 Need to normalize for different Std. deviations Active portfolio A Return Active portfolio B Benchmark Riskless asset Standard deviation Market risk Standard deviation of unlevered portfolio B has a negative Information Ratio!
Portfolio B has a Higher M2 Return M2 Return for B M2 Return for A Benchmark Return Benchmark Riskless asset Standard deviation Market risk Problem: Need to normalize for different correlations i.e., have different tracking error
Correlation-Adjustment: M3 Measure Correcting for tracking error – different rankings Standard Fund Return deviation M2 TE(basic) TE(M2) M3 (%) (%) (%) (%) (%) (%) (1) (2) (3) (4) (6) (7) (8) (12) F 5.50 0.00 0.00 B 17.09 13.27 1.00 17.09 1 33.24 27.57 0.71 18.85 20.45 10.14 18.43 2 25.63 24.93 0.77 16.21 17.02 9.04 17.43 3 25.04 25.02 0.73 15.86 17.74 9.68 17.41 4 24.08 21.33 0.80 17.06 13.34 8.38 17.65 5 21.95 21.75 0.59 15.53 17.52 11.97 17.68 6 21.90 13.84 0.84 21.21 7.76 7.57 19.26 7 21.61 14.37 0.83 20.37 8.13 7.74 18.91 8 20.89 23.06 0.79 14.36 15.07 8.69 16.70 9 20.77 14.00 0.89 19.97 6.53 6.32 18.83 10 20.56 14.79 0.92 19.00 5.74 5.24 18.43 F = Risk-free asset; B = Benchmark (S&P500)
First 1 6 6 6 6 6 1 Second 2 9 7 9 7 7 6 Third 3 7 9 7 9 9 10 Fourth 4 10 10 10 1 1 9 Fifth 5 1 1 1 10 10 7 Sixth 6 4 4 4 5 5 4 Seventh 7 2 2 2 4 4 2 Eighth 8 3 3 3 2 2 3 Ninth 9 5 5 5 3 3 5 10 8 8 8 8 8 8 Tenth Ranking Portfolios: Different Methods M3 is the only one consistent with Skill Skill using M2 or Skill using Skill using Information Ranking Unadjusted raw returns Sharpe M2 M3 M3 ratio (1) (2) (3) (4) (5) (6) (7) (8) Information ratio, Sharpe or M2 say little about Skill Skill = Confidence in Skill Measure M3
Which Measure Should you Use? • Manage portfolio yourself – Sharpe, Information Ratio or M2 • External manager and with a tracking error budget – M3 (Previous papers ignore possible actions by client) • Worried about skill – M3 • M2 provides valuable advice on leverage/ deleverage; M3 provides valuable advice on (a) active versus passive (“beta”) and leverage/deleverage Important to have a risk budget
How Do You Compare 2 Strategies with Different Data Histories? • In the past – drop non-overlapping data • Lose valuable information on strategy with longer history • SHARAD Measure – Normalizes for different risk and different data history • SHARAD = {M3 return}*{Confidence in skill (of M3 portfolio)} • Confidence in skill acts as a probability measure and explicitly captures the length of data history – more history, greater the confidence in skill
Risk Budgeting is only First Step • Cannot force tracking error ranges on managers – client needs to be evaluate how good manager is in dynamically managing risk • Risk-adjusted performance measures are the right way to go, but many are paid on the basis of excess returns • Measures can tell you how good manager is at managing risk • Use creative measures along with risk budgets to achieve optimal portfolio performance