Download
1 / 63
640 likes | 855 Views
Pre- to Post-test Analysis for Local Assessments. Michael Lance Joseph Musial MERA Conference: Fall 2012. Overview. Standards Considerations “Experimental Design” Analysis. Standards for Educational & Psychological Testing (AERA, APA, NCME, 1999).

E N D
Pre- to Post-test Analysis for Local Assessments Michael Lance Joseph Musial MERA Conference: Fall 2012
Overview • Standards • Considerations • “Experimental Design” • Analysis
Standards for Educational & Psychological Testing (AERA, APA, NCME, 1999) The purpose of the Standards “is to provide criteria for the evaluation of tests, testing practices, and the effects of test use...provides a frame of reference to assure that relevant issues are addressed” (p.2).
What happens if the Standards are ignored? Practice without theory is chaos... (Author unknown) ...and may result in law suits. (Lance & Musial)
Standard 1.1 “A rationale should be presented for each recommended interpretation and use of test scores, together with a comprehensive summary of the evidence and theory bearing on the intended use or interpretation” (p. 17).
Standard 1.2 “The test developer should set forth clearly how test scores are intended to be interpreted and used. The population(s) for which a test is appropriate should be clearly delimited, and the construct that the test is intended to assess should be clearly described” (p. 17).
Low-stakes Testing According to the Standards, “A low-stakes test...is one administered for informational purposes or for highly tentative judgments such as when test results provide feedback to students, teachers, and parents on student progress during an academic period” (p. 139).
High-stakes Testing A high-stakes test is when the “aggregate performance of a sample, or of the entire population of test takers, is used to infer the quality of service provided, and decisions are made about institutional status, rewards or sanctions based on test results” (p. 139).
Reliability Reliability refers to the consistency of measurements when the testing procedure is repeated on a population of individuals or groups (p. 25)....When test scoring involves a high level of judgment, indexes of scorer consistency are commonly obtained (p. 27).
Reliability Primer Reliability: Pertains to the consistency of scores over time It is reported as a coefficient (r) & ranges 0 – 1.00 It is a function of scores or data on hand Reliability > Validity Low-stakes: r ~ .70 and high-stakes : r ~ .90 Source: Nunnally (1978), Thompson (2003)
Reliability is frequently determined through correlations * * Form A * * * * * * * Form B
Types of Reliability Coefficients: Administration of parallel forms in independent testing sessions (alternate-form coefficient). Administration of the same instrument on separate occasions (test-retest/stability coefficient). Administration from a single test (internal consistency coefficients).
Validity “Validity refers to the degree to which evidence and theory support the interpretations of test scores entailed by proposed uses of tests...it is the interpretations of test scores required by proposed uses that are evaluated, not the test itself” (p. 9).
Standard 3.1 “Tests and testing programs should be developed on a sound scientific basis. Test developers and publishers should compile and document adequate evidence bearing on test development “(p. 43).
Standard 3.2 “The purpose(s) of the test, definition of the domain, and the test specifications should be stated clearly so that judgments can be made about the appropriateness of the defined domain for the stated purpose(s) of the test and about the relation of items to the dimensions of the domain they are intended to present” (p. 43).
Considerations • Pedagogical • i.e. assumption of prior knowledge • Technical • i.e. mastery learning • Logistical • i.e. testing
What are the assumptions? • Do we assume zero prior knowledge? • How would a group of students perform on a Chinese Language pretest? • What factors influence prior knowledge? • Do students receive supplemental enrichment that would impact pre-test? • Do students have access to computer-based support at home/library?
Mastery Learning • ...leads to an all-or-nothing score, suggesting the student has or has not met the pre-established mastery level. • “When basic skills are tested, nearly complete mastery is generally expected...80 to 85% correct items....” (Anastasi and Urbina, 1997).
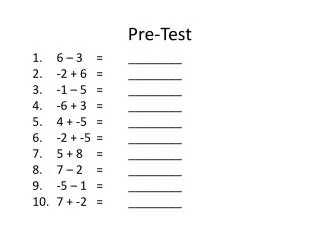
Who did better on this 100-item test? • Joe’s pre-test = 20 • Michael’s pre-test = 85 • Joe’s post-test = 70 • Michael’s post-test = 100
Teacher-made test • Referred to as criterion-referenced or domain-referenced • The focus is on what test takers can do and what they know compared to what is expected • In contrast, when a student is compared to others, we refer to this as norm-referenced • The number of test items on a domain-referenced test reflects the intended instruction and curriculum standards, emphasizing that which students should be able to demonstrate as a result of the instruction.
What is a posttest cut score? • Picture a high jump bar: “how high did we set the bar?” • A math department would review the test as if they were a minimally competent student • The teachers would then place a (+) next to each correct item and a (–) next to each correct item • This is a Modified Angoff Method
during pre-/post-testing... ...the pretest assesses baseline knowledge ...analysis generates a difference score (D) ... “difference scores”, those that are statistically significant, suggest that the improvement was related to the instruction and not chance factors
What are my post-test options? • Administer the same test • Scramble the same test: Q1 on pretest is now Q25 on posttest • Equivalent form – the item measures the same thing: pretest Q5: 236 posttest Q5: 635 + 529 + 218
More Options... • Alternative form test would include a different test that basically assesses the same content but in an alternative fashion. • An example would be two different reading passages. • Test 1 could ask the student to read a passage and underline the verbs. • Test 2 could ask the student to read a passage and then choose a verb from a multiple choice item.
What does a hard pre-test look like? X X A Floor Effect has Occurred X X X X X X X XXX X XXX X XXXX X XXXXXXThis is positively skewed X XXXXXXXXXX ____________________________________________________ 0 2% 5% 10% 15% 20% 25% 30%
What does an easy pre-test look like? A Ceiling Effect has Occurred X X X X X X X X X X X X This is negatively skewed X X X X X X X X X X X X X X X X X X X X X X X X X X X ____________________________________________________ 0 65% 70% 75% 80% 85% 90%
“Experimental” Design • Not really an experiment (hence the “quotes”) • No random selection or assignment • More like a “queasy-experiment” • Below are some threats to consider (Campbell & Stanley, 1963)
History • Event(s) which may confound with the treatment effect. Such events affect all students equally. • see also intra-session history, where within one test session/setting (or trial), something happens. • Example: • Pre-test • Receive instruction • Flu bug spreads through class • Extra tutoring • Post-test
History • Is the effectiveness of the treatment measurable given the history (i.e. sickness)? • Flu bug • Extra tutoring • Air conditioner broken during lesson(s)
Maturation • A process occurring within subjects over time that may confound with the treatment effect. This process affects all students equally. • Example: • Pre-test • Receive instruction • Naturally learn more over time • Post-test
Maturation • Is the “growth” due to the efficacy of the reading program (the treatment) or natural growth in reading expected for that group of students? • Time elapsed between tests • Nature of what is assessed and what is normally learned outside of school • i.e. Natural attention span of 2nd graders in September vs. January
Testing • Exposure to the pre-test changes the potential responses to post-test items, regardless of the “treatment”. • Example: • Pre-test • Receive instruction • Students remember test questions/answers • Post-test
Testing • Is the "growth" between tests due to the efficacy of the tutoring or the exposure to the pre-test questions? • Comparability and sufficient difference between tests (items) • Test/item exposure and memory: do not exhaust test items • Freshman psych classes who take a lot of tests throughout the year.
Instrumentation (decay) • Changes in calibration of instruments or scores from pre to post-tests affect growth between tests. • Example: • Pre-test • Receive instruction • Tests are scored • Post-test • Tests are scored with inconsistent scrutiny or rubric And/Or: • Post-test has more/less reliability and/or validity
Instrumentation (decay) • Is the "growth" due to the treatment or the reliability of the instrument? • Look at reliability estimates • Ensure testing conditions are consistent (i.e. scrap paper or calculators offered both times)
Statistical Regression • Artificial growth or loss due to measurement error from pre to post-tests. • Example: • Pre-test (highest score) • Receive instruction • Post-test (lower score)
Statistical Regression • Are the top students scoring lower due to variability in test accuracy or because they are forgetting things? • Are the lowest students now scoring higher due to test variability or are they learning more? • Ceiling effects and floor effects • SEM inflated at extremes of many assessments
Other • No measure for how students of different pre-test scores do on post-test compared to others • Not establishing expected gains based on quantiles of pre-tests and norm data • Not taking SEMs into account
Time Interval • According to L.R. Gay (1992), a 2-week period between the pre-test and posttest is the minimum time-frame suggested before a test-retest reliability coefficient should be derived (p. 163).
How we can help students • Maintain the same test environment during pretesting/posttesting • Help eligible students receive Free and Reduced Priced Lunches • Consider access to food (not only during a test administration) • Consider students with accommodations IEP e.g. read aloud, resource environment, alternative assessment
Advantages.... • Results obtained by hand or computer e.g. Excel • It is quantifiable • Class performance can be visually displayed with vibrant colors • Teachers may use a commercially available test (ACT EXPLORE/PLAN) • Encourages test blueprinting • Source: Isaac & Michael (1997)
Analysis • Statistical details • Description of Excel file • Recommendations
Analysis • Paired (dependent samples) t-test • Not ANOVA • Mathematically equivalent to paired t-test • Yet more complex to do and explain with MS Excel • Not ANCOVA • Since not randomized and complex to do and explain with MS Excel • Not Wilcoxon signed-rank test • Paired t-test sufficiently robust to most situations and much easier to work with in Excel.
Analysis • One group pre-test post-test design • Using a paired t-test to • analyze gains • in light of threats to validity. • The end users of this information are teachers and administrators. • May also be helpful for evaluation a program
Difference score (D) layout • Source: Gravetter & Wallnau (2000)
Analysis • Effect Size (difference expressed in S.D.s) • Excel file refers to Sawilowsky (2009) new E.S. categories.
Analysis Goal: Catalogue effect sizes resulting from using the Excel file • To provide more accurate category estimates • Per grade level and subject area • Per topic/unit/skill • Per other factors?