Download
1 / 67
670 likes | 764 Views
Critical Outcomes Report Analysis. January 10, 2008. Agenda. Overview of Why Reports are wrong and how to fix them and be a hero to your organization…. …Rather than rely on others for your measurement. Reasons Why Reporting is often Wrong.

E N D
Critical Outcomes Report Analysis January 10, 2008
Overview of Why Reports are wrong and how to fix them and be a hero to your organization…
Reasons Why Reporting is often Wrong • Look at these “checks and balances,” and ask yourself, why aren’t you already doing this in contracts with your vendor?
Three reasons reports are wrong • No one does a Dummy Year Analysis The exact same methodology applied to a year in which you did not have disease management • No one checks for plausibility • No one says, “wait a second – this doesn’t make sense.” This is Critical Outcomes Report Analysis
Dummy Year Analysis • Most contracts have a baseline period to which a contract period is compared (adjusted for trend) • Watch what happens when you have a baseline and then compare a contract period (adjusted for trend) • Just the analysis, no program
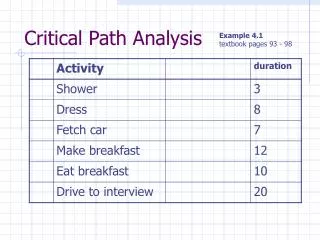
In this Dummy Year Analysis example • Assume that “trend” is already taken into account • Focus on the baseline and contract period comparison
Base Case: Example from AsthmaFirst asthmatic has a $1000 IP claim in 2005
Example from AsthmaSecond asthmatic has an IP claim in 2006 while first asthmatic goes on drugs (common post-event) What is the Cost/asthmatic In the baseline?
Cost/asthmatic in baseline? Vendors don’t count #2 in 2005 bec. he can’t be found
Base Case: How Dummy Year Analysis (DYA) fixes it In this case, a “dummy population” falls 45% on its own without DM
So… • If you were to do an asthma program the vendor should not get credit for the reduction that happens anyway • But they do • How do we know that? With a plausibility test, to be discussed later • First, some real-world Dummy Year Analyses (DYAs)
DYA real-world Result: Excerpt from Regence Blue Cross-DMPC study for Health Affairs released recently
DYA Result By Disease (using 1-year baseline and standard DMPC algorithms) – what is the difference which is caused automatically by just trending forward?
DYA Result in Wellness Source: Ariel Linden – citation On request
There was no program in this case – just two samplings and the average stayed the same Source: Ariel Linden – citation on request
Other evidence for Dummy Year Analysis (DYA) • CMS studies – very carefully designed -- get results opposite those done without DYAs, and consistent with those done with DYAs • Only one vendor does a DYA-like adjustment • Watch what happens when you get results “adjusted for trend” -- • ROIs without DYA adjustment flunk plausibility testing…
Impact of adjustment similar to DYA on Highmark (Medicare)Data courtesy of www.soluciaconsulting.com
Other evidence for Dummy Year Analysis (DYA) • CMS studies – very carefully designed -- get results opposite those done without DYAs, and consistent with those done with DYAs • Watch what happens when you get results “adjusted for trend” -- • Reports like that just scream out for plausibility testing…
Three reasons reports are wrong • No one does a Dummy Year Analysis The exact same methodology applied to a year in which you did not have disease management • No one checks for plausibility • No one says, “wait a second – this doesn’t make sense.” This is Critical Outcomes Report Analysis
What is a plausibility test? • You do it all the time…outside DM • An easy way to directionally check results • Measure total event rates for diseases being managed, like you’d measure a birth rate. Couldn’t be easier • Specific codes on the next page • Specific fine-tuning rules available from me • Example from previous asthma hypothetical
Event rates tracked by disease: the Plausibility Indicators [1] 493.2x is asthma with COPD. It could fit under either category but for simplicity we are keeping it with asthma
Asthma events in the payor as a whole – the plausibility check
Plausible? • How can you reduce asthma costs 45% without reducing planwide asthma event rate? • Answer: You can’t. Not plausible
Several Examples of Plausibility Analysis • Pacificare • Some which didn’t turn out so well • Plausibility-testing generally and benchmarks
Several Examples of Plausibility Analysis • Pacificare • Some which didn’t turn out so well
Example of just looking at Diagnosed people: Vendor Claims for Asthma Cost/patient Reductions ER ER IP IP
What we did to plausibility-test… • We looked at the actual codes across the plan • This includes everyone • Two years of codes pre-program to establish trend • Then two program years
Baseline trend for asthma ER and IP Utilization 493.xx ER visits and IP stays/1000 planwide ER ER IP IP
Expectation is something like…493.xx ER visits and IP stays/1000 planwide ER ER ER ER IP IP IP IP
Plausibility indicator Actual: Validation for Asthma savings from same plan including ALL CLAIMS for asthma, not just claims from people already known about493.xx ER visits and IP stays/1000 planwide ER ER ER ER IP IP IP IP How could the vendor’s methodology have been so far off?
We then went back and looked… • …at which claims the vendor included in the analysis…
We were shocked, shocked to learn that the uncounted claims on previously undiagnosed people accounted for virtually all the “savings” Previously Undiagnosed Are above The lines ER ER ER ER IP IP IP IP
Is it fair… • To count the people the vendor didn’t know about?
You should be able to reduce visits in the known group by enough so that adding back the new group yields the reduction you claimed – otherwise you didn’t do anything Previously Undiagnosed Are above The lines ER ER ER ER IP IP IP IP
The intersection of Dummy Year and Plausibility • “You can’t hold us responsible for people we couldn’t have known about.” • Think about that statement. It says, “We want to ride that RTM curve down but (aside from DMPC contracts, and one vendor) we don’t offer a DYA to see what that RTM curve is
Applying Plausibility to Mercer presentation which found a “range” of possible savings in Respiratory DM • Mercer’s view: “Varying the methodology has a significant impact on the results” Results “somewhere in that range” • Our View: There is only one right answer and a Plausibility test will point to it
How Mercer could do a plausibility test on asthma • Take two-three years of claims history in all primary-coded 493.xx claims for ER and IP • Add together and divide by # of covered lives to get a rate • Then Ask: What happens in the program year?
For the program to have saved $6-million, this indicator would have to plunge(it didn’t)
Let’s Macro-Plausibility-Test Wellness • The Dummy Year Analysis • Plausibility Testing • For Wellness • Critical Outcomes Report Analysis
Macro Plausibility for WellnessHere’s how you know wellness reports are inflated or impossible • Compare all these reported dramatic results in smoking cessation and weight loss to CDC statistics for the US as a whole • Even as most large (and many smaller) companies are “producing” these results, obesity continues to climb and the drop in adult smoking rates has stalled
October 26, 2006 Drop in Adult Smoking Rate Stalls THURSDAY, Oct. 26 (HealthDay News) -- The number of adult smokers in the United States did not change from 2004 to 2005, suggesting that the decline in smoking over the past seven years has stalled, a new federal report found. In 2005, 45.1 million adults, or 20.9 percent, were cigarette smokers – 23.9 percent of men and 18.1 percent of women. In addition, 2.2 percent of U.S. adults were cigar smokers and 2.3 percent used smokeless tobacco, according the report. "After years of progress, what we are seeing is no change in adult prevalence of smoking between 2004 and 2005," said report author Terry Pechacek, the associate director for science at the U.S. Centers for Disease Control and Prevention's Office on Smoking and Health.
Obesity Trends* Among U.S. AdultsBRFSS, 1985 (*BMI ≥30, or ~ 30 lbs. overweight for 5’ 4” person) No Data <10% 10%–14%