Download
1 / 7
110 likes | 366 Views
Resource Levelling As well as considering the time scale for a project we need to consider the resources needed. This will often be the number of people available. In this demo Activities A and B require 4 people each and C, D, E and F require 2 people. Resource Histogram

E N D
Resource Levelling As well as considering the time scale for a project we need to consider the resources needed. This will often be the number of people available. In this demo Activities A and B require 4 people each and C, D, E and F require 2 people
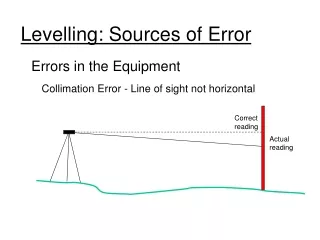
Resource Histogram This is used to allocate the resources most effectively – employ the least number of people. Step 1 Draw the activity network Step 2 Draw the Gantt chart . Critical Activities: A,B,C,D – no float Gantt chart
In this demo Activities A and B require 4 people each and C, D, E and F require 2 people Step 3 Draw the resource histogram with the number of people required if all the activities start at the earliest start time. Put Critical Activities on the bottom and all other activities starting at the earliest time possible.
Critical Activities : A, B, C, D Activities A and B require 4 people each and C, D, E and F require 2 people Resource Histogram People Note how the critical activities go along the bottom and the other activities are stacked above at the earliest possible start time
Now attempt to level it and reduce the number of people. People People F F As F has 2 hours of float it can be slid to the right . E must be finished by 4hrs so can go anywhere before the 4 hr mark. So 4 people are needed for 4 hrs and 6 people for 1hr
Demo 2 See how the bars follow the precedence rules Critical Activities: A,B,G – no float Note how the critical activities go along the bottom and the other activities are stacked above at the earliest possible start time Holes are NOT allowed Resource Histogram
It appears that 5 people are needed: 1 for activity B and 2 each for activities A and C E shifted 1 hr later C shifted right to start at 2 D shifted right to start at 3 F shifted right to start at 6 3 people are therefore required The Hole has been removed Levelled Resource diagram