Download
1 / 34
340 likes | 435 Views
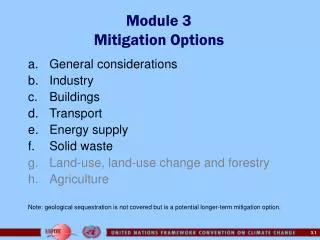
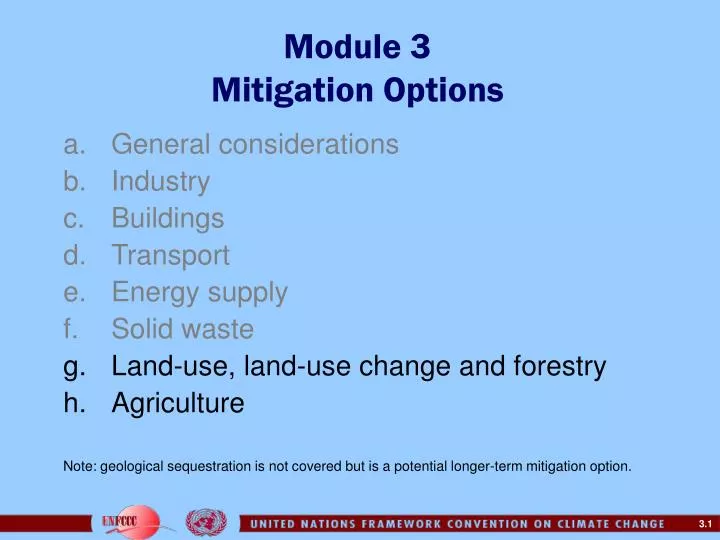
Module 3 Mitigation Options. General considerations Industry Buildings Transport Energy supply Solid waste Land-use, land-use change and forestry Agriculture Note: geological sequestration is not covered but is a potential longer-term mitigation option. Module 3g.

E N D
Module 3Mitigation Options • General considerations • Industry • Buildings • Transport • Energy supply • Solid waste • Land-use, land-use change and forestry • Agriculture Note: geological sequestration is not covered but is a potential longer-term mitigation option.
Module 3g LULUCF: Land-use, land-use change and forestry
Key LULUCF Sectors 1. Forestry 2. Rangelands and Grasslands 3. Agriculture
Role of LULUCF Sectors in Global GHG Emissions Global Emissions per year (early 1990's) Fossil fuelsLanduse sectors Carbon Emissions (GtC) 6.0 +- 0.5 1.6 +- 0.4 Methane (Tg) 100 400 Other GHG (Anthropogenic) Significant but < 5 % Net Sequestration (GtC) 0 0.7 +- 0.2 Climate change impacts (2*CO2) Projections by three GCMs show an increase of total forest area from 8 - 13 % of the current 82.7 Mi km2, and mixed impacts on drylands and agricultural areas in different regions of the world
Key Steps in LULUCF Mitigation Assessment • Identification and categorization of the mitigation options appropriate for carbon sequestration. • Assessment of the current and future land area available for mitigation options. • Assessment of the current and future demand for products and for land. • Determination of the land area and product scenarios by mitigation option. • Estimation of the C-sequestration per ha. for major available land classes, by mitigation option. • Estimation of unit costs and benefits. • Evaluation of cost-effectiveness indicators. • Development of future carbon sequestration and cost scenarios. • Exploration of policies, institutional arrangements and incentives necessary for the implementation of mitigation options. • Estimation of the national macro-economic effects of these scenarios.
Potential Area Available for Mitigation in Select Countries (million ha)
Footnotes for Area Availability Table • * Source = FAO Forest Resource Assessment 2000, with –ve figure implying threshold. a – 20% crown cover. Data are for 1998. b – Data for 1995; c—Data for 1995-97; d-- Degraded lands in three study regions in 2000; e-- Unproductive land, grasslands and critical lands; f-- Annual average for 1990-1997 (includes transmigration and agricultural development, forest fire and shifting cultivation; excludes illegal logging). g --Grassland areas, sub-marginal forests and brushlands; h-- Annual average for 1995-1998 period; i: Early 1990s. Forest area includes semi-arid vegetation, which accounts for 66 Mha;; j-- Degraded forest land; k-- Forested area in three study regions. Total forested area is 158,941 thousand ha; l-- Estimated potential for natural regeneration, farm forestry and plantations from Trexler and Haugen, 1995; m-- 1978 to 1997 data from Brazil web site (www.mct.br/clima/ingles/communic_old/amazinpe.htm); n-- Forests and “cerrados” located in the Amazon region only. o--3.5 mi. ha for short rotation community woodlots, and 2.5 mi. ha (50% of the fallow area) for reforestation and 1.5 mi. ha for all other forestation including agroforestry, long rotation plantations, non-forest tree crops (wattle, rubber, oil palm, etc). p – Figures from Trexler and Haugen, 1995. Estimated potential in regeneration, farm forestry and plantations between 1990 and 2040.
Forestry Mitigation Options 1. Reducing GHG emissions through: - conservation and protection - efficiency improvements - fossil fuel substitution 2. Sequestering carbon through: - increased vegetation cover - increased carbon storage in soils - conversion of biomass to long-term products
Drylands Mitigation Options Rangelands and Grasslands: • Reduction of Emissions • Improved range and fire management • Improved animal husbandry • Biomass replenishment • Carbon Sequestration: • Biomass replenishment • Enhanced soil carbon storage
Agriculture Mitigation Options 1. Emission Reduction through improved: • Rice cultivation • Animal husbandry • Fertilizer application • Cultivation methods 2. Carbon Sequestration in: • Agroforestry • Agricultural tree crops • Soil carbon storage
Agricultural Sector Mitigation Assessment • Included Gases and Activities • CH4 from Livestock • Enteric Fermentation (digestive) • Manure Management • CH4 from Rice Cultivation • N2O from Disturbance of Agricultural Soils Note: Open Biomass burning of agricultural waste is covered under Land-use Change and Forestry
Main Sources of Emissions from AgricultureCH4 Emissions from Livestock and Manure • Enteric Fermentation • CH4 emitted from normal digestive processes • Main source: mostly ruminant animals, e.g. cattle and sheep, & non-ruminants e.g. horses and pigs • Main factors influencing emissions: • type of digestive system • age • weight • quality and • quantity of feed intake
Main Sources of Emissions from AgricultureCH4 Emissions from Livestock and Manure 2. Manure from livestock • CH4 is emitted from anaerobic decomposition of organic matter, mostly slurry/liquid manure • Main factors are: • manure management system • temperature • quantity of manure produced
Baseline Emissions from AgricultureCH4 Emissions from Livestock and Manure Proposed approach • Identify the target animal types for mitigation • Estimate animal population by animal types • Select emission factor per head for each animal type • Tier 1 countries: Select from standard default values • Tier 2 countries: Develop emission factors based on country specific conditions • Multiply animal population by emission factor to obtain baseline emission levels
Baseline Emissions from AgricultureCH4 Emissions from Livestock and Manure Cattle categories: • Dairy cattle: Milk producing cows for commercial exchange and calves as well as heifers being kept for future diary production • Non-dairy cattle: All non-diary cattle, including cattle for beef production, draft and breeding animals
Baseline Emissions from AgricultureCH4 Emissions Factors for Enteric Fermentation
Strategies for Reducing Ruminant CH4 Emissions • Improved Nutrition via mechanical and chemical feed processing • Improved Nutrition via Strategic Supplementation e.g. providing microbial and/or by-pass protein supplements • Production Enhancing Agents e.g. Bovine somatotrophin(bST) and anabolic steroid implants • Improved Production through genetic improvements • Improved Reproductive Efficiency.
Baseline Emissions from AgricultureCH4 Emission Factors for Manure Management
Baseline Emissions from AgricultureCH4 Emission Factors for Manure Management
Emissions from AgricultureCH4 Emissions from Livestock and Manure • Tier 1 Method • Perform for each animal type for each climatic region if applicable • Annual Emissions =Pop*[EFenteric +EFmanure] • Note: The term Tier 2 applies to those countries with large numbers of livestock with substantial contribution to national emissions.
Emissions from AgricultureCH4 Emissions from Livestock and Manure • Tier 2 Recommended Method: • Detailed animal types • Detailed animal and feed characteristics • Estimate feed intake • Detailed manure management data and country specific emission factors
Emissions from AgricultureCH4 Emissions from Livestock and ManureRecommended representative cattle types for Tier 2
Baseline Emissions from AgricultureCH4 Emissions from Livestock and Manure • Tier 2 Method for Enteric Fermentation (by animal type) • Emissions (kg CH4/yr) =(GE * Ym * 365 days/yr)/(55.65 MJ/kg CH4) • where: • GE = daily gross energy intake (MJ/day) • Ym = methane conversion rate (default = 0.06) • GE = [(NEm + NEf + NEl + NEd + NEp)/(NE/DE) + (NEg/(NEg/DE)] * (100/DE%) • where: • NE = Net Energy DE = Digestive Energy
Baseline Emissions from AgricultureCH4 Emissions from Livestock and Manure • Tier 2 Method for Manure Management (by animal type) • Emissions (kg CH4/yr) = VS * 365 days/yr * B0 *0.67 kg CH4/m3 * jk(MCFjk) * MS%jk) Where: • VS = daily volatile solids excreted (kg/day) • B0 = maximum methane producing capacity for manure (m3 CH4/kg VS) • MCF = methane conversion factor • MS% fraction of animal type’s manure handled • jk = manure management system j in climate k
Manure Management Mitigation Options • Covered lagoons – methane recovered for farm energy use • Small scale digesters – enhances anaerobic decomposition of organic material which yields CH4 for energy • Large scale digesters – for large operations and are much more complex but based on the same principle.
Baseline Emissions from AgricultureCH4 Emissions from Flooded Rice Fields Overview - Decomposition of organic material in flooded rice fields produces CH4. - CH4 escapes to the atmosphere primarily by diffusive transport through rice plants. - Flux rates are highly variable, both spatially and temporally -- depending on water management, soil temperature, soil type and cultivation practices. - The method is revised in the Revised 1996 IPCC Guidelines
Emissions from AgricultureCH4 Emissions from Flooded Rice Fields Definitions - Growing season length: The average (for the country or subcategory) length of time in days, from seeding or transplanting until harvest - Continuously flooded: Fields inundated for the duration of the growing season - Intermittently flooded: Inundated part of the time - Dry (upland): Fields seldom flooded during the growing season - Harvested area: Accounts for multiple cropping per year; harvested area=>cultivated area.
Mitigation Options for Rice Cultivation • Nutrient Management – Using N fertilizers and reducing use of raw organic materials can reduce CH4 emissions from paddy fields* • Water management – Intermittent draining of rice fields during the growing season or between croppings. Also by increasing water percolation rate in fields.
Estimating Emissions from AgricultureCH4 Emissions from Flooded Rice Fields Apply to each water management regime Emissions (Gg CH4) = Harvested Area (Mha/yr) x Growing season length (days) x Emission Factor (kg Ch4/ha/day) Emission factors: depend on water management and average growing season temperature
Emissions from AgricultureCH4 Emissions from Flooded Rice Fields CH4 Emissions =i Harvested Area x SFi x CFi x EFi Where: SFi = scaling factor for each water management system i. CFi = Correction factor for organic amendments applied in each water management system i. EF = Seasonally integrated emission factor for continuously flooded rice without organic amendments
Emissions from AgricultureEmissions from Agricultural Soils Overview: • Agricultural soils may emit or sequester N2O, CO2 and CH4 • Fluxes are affected by a wide variety of natural and management processes, the effects of which are not clearly understood • The methodology currently only includes N2O • The methodology is significantly revised in the Revised 1996 IPCC Guidelines
Emissions from AgricultureEmissions from Agricultural Soils Recommended Methodology: N2O Emissions (103 tN/yr) = i(Fmn + Fon + Fbnf) x Ci x 44/28) Where: • i = low, medium, high • Fmn = amount of mineral fertilizer applied • F = amount of organic material (animal manure and crop residues) applied • Fbnf = amount of biological N-fixation added • C = Emission coefficient
Emissions from AgricultureEmissions from Agricultural Soils Ranges of Emission Coefficients for N2O from Agricultural Soils Tg (N2O-N): Emission type Expert Group Alternative Recent Recommendations Calculations2 Analyses3 19931 Low 0.0005 0.0014 0.0025 Medium 0.0036 0.0034 0.0125 High 0.039 0.037 0.0225 Footnotes 1 Values were suggested by an expert group during the Amersfoot workshop (Bouwman and Mosier, 1993). They are not representative of global figures because they are based on mineral fertilizer use for each type. 2 In response to comments on the draft Guidelines, a range of coefficients was calculated based on figures in Table 5-9 of the OECD/OCDE (1991) report. 3 Provided by Mosier (1994) based on detailed analysis of currently available measurement data. In these Guidelines, these are the recommended coefficients.
Emissions from AgricultureEmissions from Agricultural Soils Revisions in the Revised 1996 Guidelines • Revised methodology takes into accountboth direct and indirect emissions of N2O and includes additional sources of N that are applied, deposited or made available in the soil.