Download
1 / 12
140 likes | 390 Views
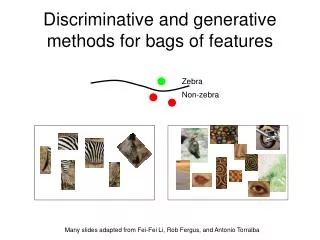
Discriminative and Generative Classifiers. Tom Mitchell Statistical Approaches to Learning and Discovery, 10-702 and 15-802 March 19, 2003 Lecture based on “On Discriminative vs. Generative classifiers: A comparison of logistic regression and naïve Bayes,” A. Ng and M. Jordan, NIPS 2002.

E N D
Discriminative and Generative Classifiers Tom Mitchell Statistical Approaches to Learning and Discovery, 10-702 and 15-802 March 19, 2003 Lecture based on “On Discriminative vs. Generative classifiers: A comparison of logistic regression and naïve Bayes,” A. Ng and M. Jordan, NIPS 2002.
Lecture Outline • Generative and Discriminative classifiers • Asymptotic comparison (as # examples grows) • when model correct • when model incorrect • Non-asymptotic analysis • convergence of parameter estimates • convergence of expected error • Experimental results
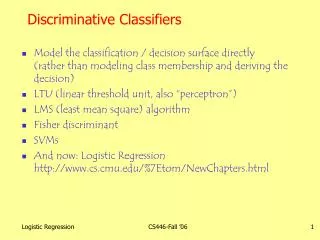
Generative vs. Discriminative Classifiers • Training classifiers involves estimating f: X Y, or P(Y|X) • Discriminative classifiers (also called ‘informative’ by Rubinstein&Hastie): • Assume some functional form for P(Y|X) • Estimate parameters of P(Y|X) directly from training data • Generative classifiers • Assume some functional form for P(X|Y), P(X) • Estimate parameters of P(X|Y), P(X) directly from training data • Use Bayes rule to calculate P(Y|X= xi)
Generative-Discriminative Pairs Example: assume Y boolean, X = <x1, x2, …, xn>, where xi are boolean, perhaps dependent on Y, conditionally independent given Y Generative model: naïve Bayes: Classify new example x based on ratio Equivalently, based on sign of log of this ratio s indicates size of set. l is smoothing parameter
Generative-Discriminative Pairs Example: assume Y boolean, X = <x1, x2, …, xn>, where xi are boolean, perhaps dependent on Y, conditionally independent given Y Generative model: naïve Bayes: Classify new example x based on ratio Discriminative model: logistic regression Note both learn linear decision surface over X in this case
What is the difference asymptotically? • Notation: let denote error of hypothesis learned via algorithm A, from m examples • If assumed model correct (e.g., naïve Bayes model), and finite number of parameters, then • If assumed model incorrect • Note assumed discriminative model can be correct even when generative model incorrect, but not vice versa
Rate of covergence: logistic regression Let hDis,m be logistic regression trained on m examples in n dimensions. Then with high probability: Implication: if we want for some constant , it suffices to pick Convergences to best linear classifier, in order of n examples (result follows from Vapnik’s structural risk bound, plus fact that VCDim of n dimensional linear separators is n )
Rate of covergence: naïve Bayes Consider first how quickly parameter estimates converge toward their asymptotic values. Then we’ll ask how this influences rate of convergence toward asymptotic classification error.
Rate of covergence: naïve Bayes classification error See blackboard
Pairs of plots comparing naïve Bayes and logistic regression with quadratic regularization penalty. Left plots show training error vs. number of examples, right plots show test error. Each row uses different regularization penalty. Top row uses small penalty; penalty increases as you move down the page. Thanks to John Lafferty.