Download
1 / 6
60 likes | 153 Views
Blood. 2013 Aug 30. [ Epub ahead of print] Prostaglandin-modulated umbilical cord blood hematopoietic stem cell transplantation.

E N D
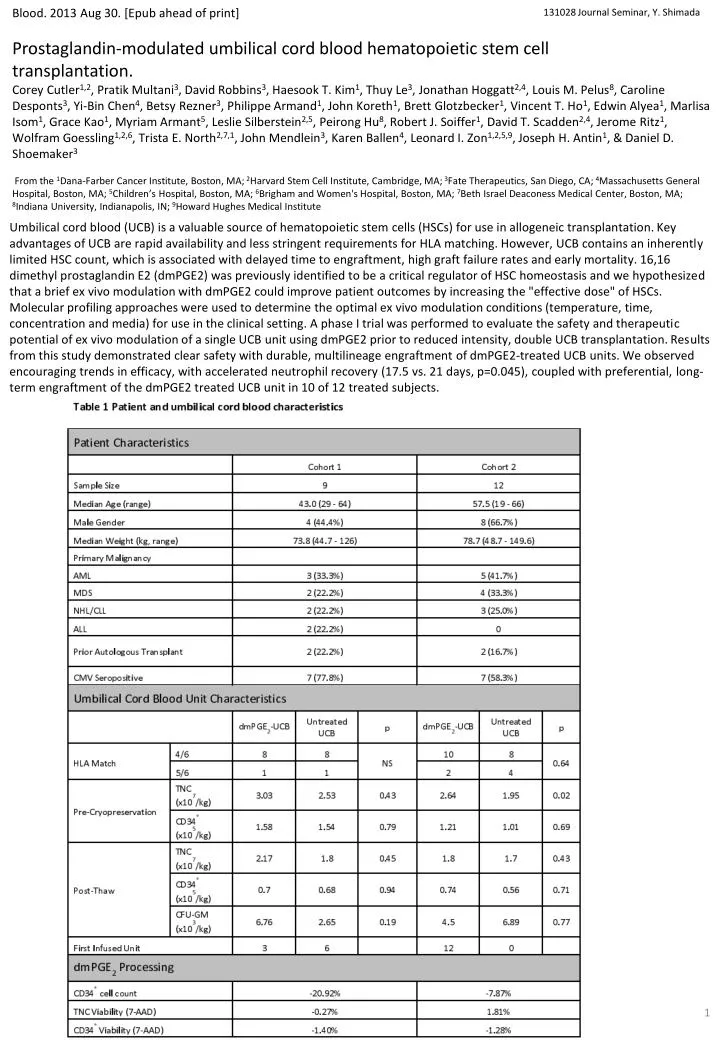
Blood. 2013 Aug 30. [Epub ahead of print] Prostaglandin-modulated umbilical cord blood hematopoietic stem cell transplantation. Corey Cutler1,2, Pratik Multani3, David Robbins3, Haesook T. Kim1, Thuy Le3, Jonathan Hoggatt2,4, Louis M. Pelus8, Caroline Desponts3, Yi-Bin Chen4, Betsy Rezner3, Philippe Armand1, John Koreth1, Brett Glotzbecker1, Vincent T. Ho1, Edwin Alyea1, Marlisa Isom1, Grace Kao1, Myriam Armant5, Leslie Silberstein2,5, Peirong Hu8, Robert J. Soiffer1, David T. Scadden2,4, Jerome Ritz1, Wolfram Goessling1,2,6, Trista E. North2,7,1, John Mendlein3, Karen Ballen4, Leonard I. Zon1,2,5,9, Joseph H. Antin1, & Daniel D. Shoemaker3 From the 1Dana-Farber Cancer Institute, Boston, MA; 2Harvard Stem Cell Institute, Cambridge, MA; 3Fate Therapeutics, San Diego, CA; 4Massachusetts General Hospital, Boston, MA; 5Children’s Hospital, Boston, MA; 6Brigham and Women's Hospital, Boston, MA; 7Beth Israel Deaconess Medical Center, Boston, MA; 8Indiana University, Indianapolis, IN; 9Howard Hughes Medical Institute 131028 Journal Seminar, Y. Shimada Umbilical cord blood (UCB) is a valuable source of hematopoietic stem cells (HSCs) for use in allogeneic transplantation. Key advantages of UCB are rapid availability and less stringent requirements for HLA matching. However, UCB contains an inherently limited HSC count, which is associated with delayed time to engraftment, high graft failure rates and early mortality. 16,16 dimethyl prostaglandin E2 (dmPGE2) was previously identified to be a critical regulator of HSC homeostasis and we hypothesized that a brief ex vivo modulation with dmPGE2 could improve patient outcomes by increasing the "effective dose" of HSCs. Molecular profiling approaches were used to determine the optimal ex vivo modulation conditions (temperature, time, concentration and media) for use in the clinical setting. A phase I trial was performed to evaluate the safety and therapeutic potential of ex vivo modulation of a single UCB unit using dmPGE2 prior to reduced intensity, double UCB transplantation. Results from this study demonstrated clear safety with durable, multilineage engraftment of dmPGE2-treated UCB units. We observed encouraging trends in efficacy, with accelerated neutrophil recovery (17.5 vs. 21 days, p=0.045), coupled with preferential, long-term engraftment of the dmPGE2 treated UCB unit in 10 of 12 treated subjects.
Figure 1 Cohort 1 clinical results a) Donor chimerism of the dmPGE2 treated umbilical cord blood unit over 360 days post transplantation (% of total) as determined from peripheral blood mononuclear cells by analyses of informative short tandem repeat (STR) loci. b) Cumulative incidence of neutrophil engraftment of greater than 500 cells/mm3, in cohort 1 (n=9, blue) compared with historical institutional controls (n=53, black). c) Cumulative incidence of platelet engraftment in Cohort 1 (n=9, blue) compared with historical institutional controls (n=53, black). Figure 2 Evaluation of ex vivo modulation temperature with cryopreserved human UCB CD34 cells with dmPGE a) Genome-wide expression analysis on Affymetrix U133 plus 2.0 GeneChips of human UCB CD34+ cells treated with 10 µM dmPGE2 for 2 hours at 4°C, 25°C, and 37°C. RMA log2 normalized expression levels for cells treated with dmPGE2 (y-axis) in comparison to vehicle treated cells (x-axis). There were 2, 19, and 192probe sets (red) with expression levels changing greater (or less) than 4 fold due to dmPGE2 treatment at 4°C (left), 25°C (center), and 37°C (right) respectively. b) Gene Ontology (GO) enrichment analysis showing biological processes enriched in the up-regulated probes induced by treatment with dmPGE2 at 37°C. Genes up-reglulated by dmPGE2 treatment at 37°C in CD34+ are listed for each GO category.
Figure 3 Optimization of incubation time, dmPGE concentration, and modulation media in cryopreserved UCB CD34 cells a) Microfluidic RT-PCR gene expression analysis of the top 90 signature genes after 10 μM dmPGE2 treatment at 37°C incubated for 0 to 240 minutes. The heat map shows log2 fold changes in expression levels relative to vehicle control treatments of the same time. b) Microfluidic RT-PCR gene expression analysis of the top 90 signature genes after 120 minutes at 37°C with varying dmPGE2 concentrations. The heat map shows log2 fold changes in expression levels relative to vehicle control treatments. c) Genome-wide expression analysis on Affymetrix U133 plus 2.0 GeneChips of human UCB CD34+ cells treated with 10 µM dmPGE2 for 2 hours at 37°C in 8%LMD/5%HSA or StemSpan-SFEM. RMA log2 normalized expression levels of expression for cells treated with dmPGE2 (y-axis) in comparison to vehicle treated cells (x-axis). There were 99 and 297 probe sets (red) with expression levels changing greater (or less) than 4-fold due to dmPGE2 treatment in LMD/HSA and StemSpan-SFEM respectively. d) Fold increase of homed CD34+ cells over control (vehicle treated) after incubation with 10 µM dmPGE2 for 2 hours at 37°C in LMD/HSA (Green) and StemSpan-SFEM (Red) (t-test, p=0.03). Figure 4 Cohort 2 clinical results a) Donor chimerism of the dmPGE2 treated umbilical cord blood unit over 360 days post transplantation (% of total) as determined from peripheral blood mononuclear cells by analyses of informative short tandem repeat (STR) loci. b) Cumulative incidence of neutrophil engraftment of greater than 500 cells/mm3, in cohort 2 (n=12, red) compared with historical institutional controls (n=53, black). c) Cumulative incidence of platelet engraftment in Cohort 2 (n=12, red) compared with historical institutional controls (n=53, black).
Nature. 2007 Jun 21; 447 (7147): 1007-1011 Prostaglandin E2 regulates vertebrate haematopoietic stem cell homeostasis. Trista E. North1,2, Wolfram Goessling1,2, Carl R. Walkley1,3, Claudia Lengerke1, Kamden R. Kopani1,2, Allegra M. Lord1,2, Gerhard J. Weber1,2, Teresa V. Bowman1,2, Il-Ho Jang1, Tilo Grosser4, Garret A. FitzGerald4, George Q. Daley1, Stuart H. Orkin1,2,3, and Leonard I. Zon1,2 1Stem Cell Program and Division of Hematology/Oncology, Children’s Hospital, Harvard Stem Cell Institute, Harvard Medical School, Boston, Massachusetts 02115, USA 2Howard Hughes Medical Institute, Boston, Massachusetts 02115, USA 3Department of Pediatric Oncology, Dana-Farber Cancer Institute, Boston, Massachusetts 02115, USA 4Institute for Translational Medicine and Therapeutics, University of Pennsylvania School of Medicine, Philadelphia, Pennsylvania 19104, USA 131028 Journal Seminar Supplement Haematopoietic stem cell (HSC) homeostasis is tightly controlled by growth factors, signalling molecules and transcription factors. Definitive HSCs derived during embryogenesis in the aorta-gonad-mesonephros region subsequently colonize fetal and adult haematopoietic organs. To identify new modulators of HSC formation and homeostasis, a panel of biologically active compounds was screened for effects on stem cell induction in the zebrafish aorta-gonad-mesonephros region. Here, we show that chemicals that enhance prostaglandin (PG) E2 synthesis increased HSC numbers, and those that block prostaglandin synthesis decreased stem cell numbers. The cyclooxygenases responsible for PGE2 synthesis were required for HSC formation. A stable derivative of PGE2 improved kidney marrow recovery following irradiation injury in the adult zebrafish. In murine embryonic stem cell differentiation assays, PGE2 caused amplification of multipotent progenitors. Furthermore, ex vivo exposure to stabilized PGE2 enhanced spleen colony forming units at day 12 post transplant and increased the frequency of long-term repopulating HSCs present in murine bone marrow after limiting dilution competitive transplantation. The conserved role for PGE2 in the regulation of vertebrate HSC homeostasis indicates that modulation of the prostaglandin pathway may facilitate expansion of HSC number for therapeutic purposes. Figure 1. Prostaglandin agonists and antagonists alter runx1/cmyb expression without affecting vascular development In situ hybridization for runx1/cmyb or flk1 at 36 h.p.f. Photomicrographs were taken with Nomarski optics at 10× (a-c, left panels) and 40× (a-c, right panels, and e-m) magnification. a-c, Representative examples of chemicals in the prostaglandin pathway discovered in the screen are shown; 10 μM linoleic acid increases, and 20 μMcelecoxib reduces HSC numbers. runx1+/myb+ HSCs are indicated: endothelial cells (arrow); haematopoietic clusters (arrowhead). d, Quantitative PCR profile of endothelial and HSC-specific gene expression following exposure to long-acting dmPGE2 (10 μM, blue) or the nonspecific Cox inhibitor indomethacin (10 μM, green) versus control (red). Both treatments resulted in statistically significant differences compared with controls for each gene examined (ANOVA, *P < 0.05; mean, s.d. and n are listed in Supplementary Table 2). e-m, dmPGE2 and indomethacin exert opposing effects on runx1/cmyb expression by in situ hybridization (e, h, k); flk1 is used to assess the effects on vascular development (f, i, l). Confocal microscopy images of cmyb-gfp; lmo2-dsRed bigenic fish exposed to dmPGE2 and indomethacin showing an increase and decrease in HSC (yellow) number along the ventral wall (yellow arrowhead) of the aorta, respectively (g, j, m). Quantitative analysis of 10 embryos in each treatment group revealed significant differences in HSC numbers (Supplementary Fig. 1i).
Figure 2. Treatment with dmPGE2 enhances haematopoietic recovery in sublethally irradiated adult zebrafish Zebrafish whole kidney marrow irradiation recovery experiments were performed. a, Representative FSC/SSC FACS profiles of haematopoietic cell lineages in the kidney marrow on days 0, 4, 7, 10 and 14 of irradiation recovery in DMSO and dmPGE2-treated (50 μM) zebrafish. b, Kinetics of kidney marrow reconstitution of precursor, lymphoid and myeloid cells in control and dmPGE2-treated fish. Statistically significant differences: †, 50 μM versus control; ‡, 50 μM versus 10 μM, and 50 μM versus control; and §, all variables significant (ANOVA, *P < 0.05; mean, s.d. and n listed in Supplementary Table 3). Figure 3. dmPGE2 modulates colony number and haematopoietic differentiation in mouse embryonic stem cells M3434 and OP9 embryonic stem cell colony-forming assays were performed; counts are per 100,000 cells plated. An asterisk (*) indicates a statistically significant difference (two-tailed t-test; mean, s.d. and n listed in Supplementary Table 4). a, Effect of increasing doses of dmPGE2 and inhibition of cyclooxygenase activity by indomethacin on haematopoietic differentiation in methylcellulose; numbers of definitive erythroid (E), mixed granulocyte/monocyte (GM), and multi-potent (GEMM) progenitor colonies are shown (10 μM dmPGE2: GM, P = 0.005; GEMM, P = 0.017; 20 μM dmPGE2: E, P = 0.04; GM, P = 0.007; GEMM, P = 0.016; 100 μM indomethacin: GM, P = 0.024). b, Effect of dmPGE2 and indomethacin on OP9 haematopoietic colony number (20 μM dmPGE2, P = 0.047).
Figure 4. Exposure of murine bone marrow to dmPGE2 increases the number of CFU-S and repopulating HSCs An asterisk (*) indicates a statistically significant difference. a, b, Effect of ex vivo treatment of WBM (2 h on ice) with ethanol control (red) or dmPGE2 (1 μM per 106 cells) on CFU-S8 and CFU-S12 (60,000 cells per recipient; CFU-S12: two-tailed t-test, control (mean/s.d./n) = 5.78/2.73/9, dmPGE2 = 15.22/2.39/9, P < 0.0001). c, Effect on CFU-S12 following ex vivo treatment with indomethacin (1 μM per 106 cells) (100,000 cells/recipient; two-tailed t-test, control (mean/s.d./n) = 8.8/2.10/10, indomethacin = 2.5/1.43/10, P = 0.0001). d, CFU-S12 evaluation after treatment of cKit +Sca1+Lineage- stem cells with dmPGE2 or ethanol control (two-tailed t-test, 100 cells: control (mean/s.d./n) = 3/1.63/4, dmPGE2 = 6.2/1.3/5, P = 0.013; 300 cells: control (mean/s.d./n) = 5/1.22/5, dmPGE2 = 11/1.87/5, P = 0.0003). e, f, Limiting dilution competitive repopulation assay. The number of negative recipients as determined by FACS analysis (e) in relation to the total number of cells transplanted for control or dmPGE2- treated cell samples is shown at 12 weeks. P0 = 67,884 (control) and 16,970 (dmPGE2 treated). The frequency of engraftment (f) at 6, 12, and 24 weeks post transplantation in recipients of ethanol- versus dmPGE2-treated WBM calculated by Poisson statistics (ANOVA, n = 10 per variable; 6 wks, P = 0.005; 12 wks, P = 0.002; 24 wks, P = 0.05); the number of recipients surviving to analysis at each time point is shown in Supplementary Tables 7-9.