Download
1 / 15
150 likes | 259 Views
We have analysed more than 29,000 responses from users of this tool on our website www.policyadvisor.in to gather some insights about the proportion of users looking to buy health insurance or those looking to revise their health insurance plans and what is the current status of health insurance in India.

E N D
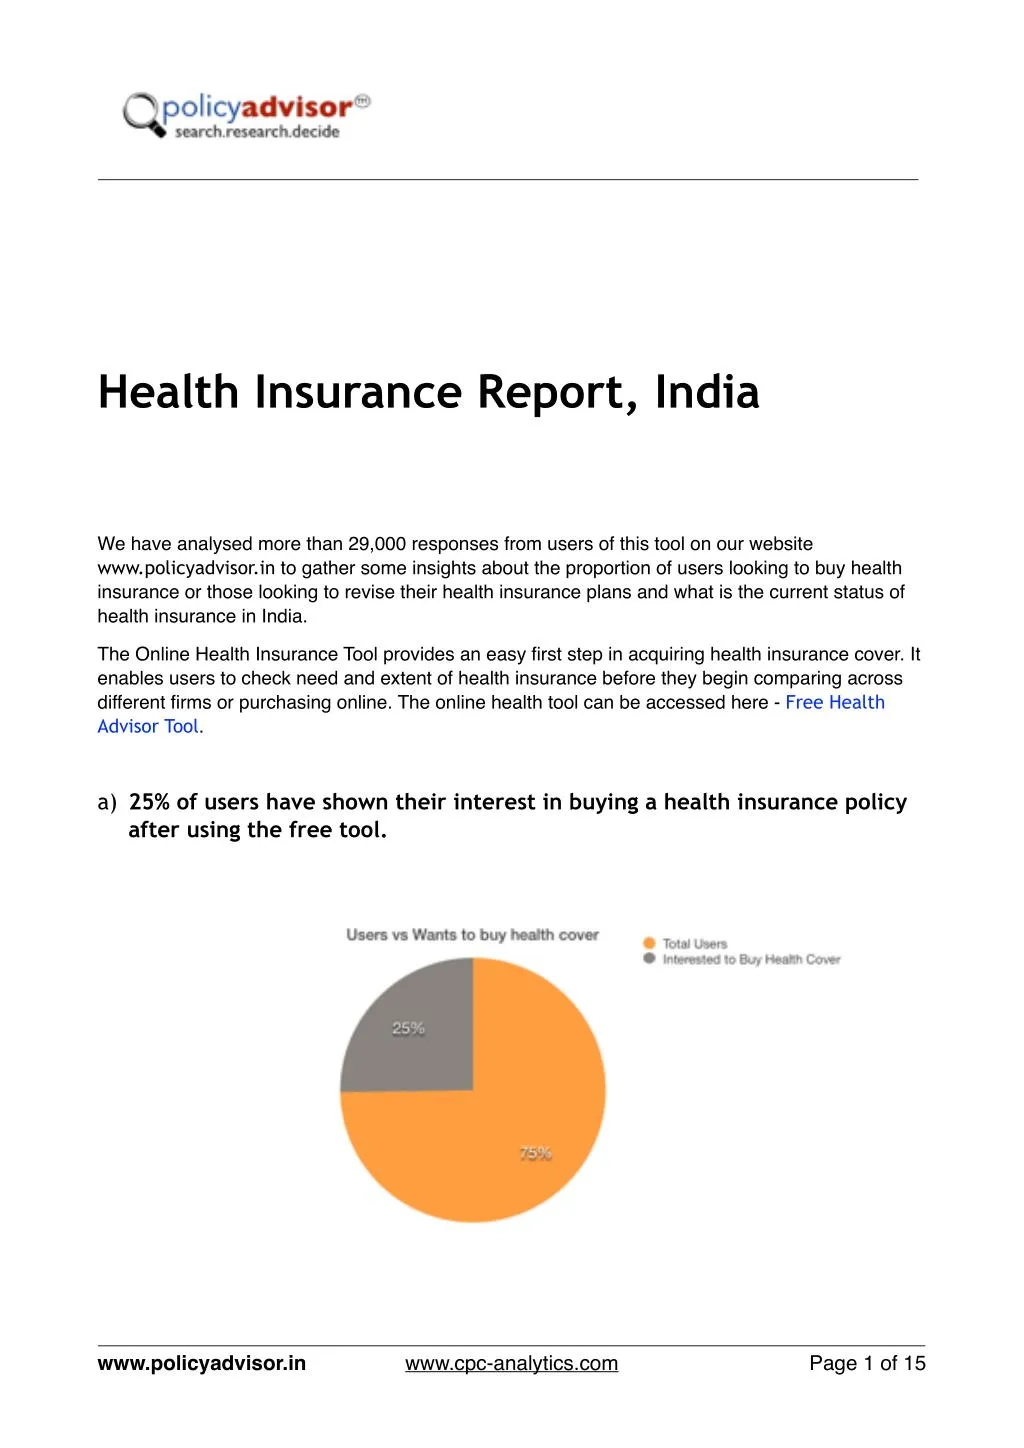
? ? Health Insurance Report, India We have analysed more than 29,000 responses from users of this tool on our website www.policyadvisor.in to gather some insights about the proportion of users looking to buy health insurance or those looking to revise their health insurance plans and what is the current status of health insurance in India. The Online Health Insurance Tool provides an easy first step in acquiring health insurance cover. It enables users to check need and extent of health insurance before they begin comparing across different firms or purchasing online. The online health tool can be accessed here - Free Health Advisor Tool. a) 25% of users have shown their interest in buying a health insurance policy after using the free tool. ? www.policyadvisor.in www.cpc-analytics.com Page ? of ? 1 15
? ? b) 17% of the users on the site had an existing Health insurance cover. c) 18% of user are looking to increase their existing health insurance cover or want to buy a top-up plan. ? www.policyadvisor.in www.cpc-analytics.com Page ? of ? 2 15
? ? d) 63% of users looking to buy health insurance cover are married. e) Users in the age group of 31-40 years are more keen to buy a health insurance policy. ? www.policyadvisor.in www.cpc-analytics.com Page ? of ? 3 15
? ? f) 5% of users have incurred large hospital expenses in the last one year. g) Users having health insurance cover have spend more towards hospital expenses. ? www.policyadvisor.in www.cpc-analytics.com Page ? of ? 4 15
? ? h) Users in the age group 51-60 years have the highest spend towards hospital or medical expenses in the last one year. Detail Report & other analysis: The following matrix condenses the distribution of population across the occurrence of diseases and the purchase of health insurance. Have Diseases Healthy With Health Insurance 22.76% 77.24% Without Health Insurance 9.81% 90.19% Table 1: Insurance disease matrix More healthy individuals expressed interest in buying or revising the value of their health insurance than unhealthy ones. The diseases that this population group reported having can be seen from the figure [] below. The distribution is roughly the same for both groups. Diabetes afflicts most individuals in both the insured and the uninsured category. The average medical cover for this sample is INR 3.5 lacs. ? www.policyadvisor.in www.cpc-analytics.com Page ? of ? 5 15
? ? Characteristics Segregated by Age 24% of the people interested in buying health insurance fall in the 20-30 age group. Have Diseases Healthy With Health Insurance 20.14% 79.86% Without Health Insurance 4.63% 95.37% Table 2: Insurance- Disease Matrix in the 20-30 age group More healthy people than unhealthy seek insurance. The average medical cover for those already insured is INR 2.72 lacs. Of the diseases that do plague the remaining population in this age group, the distribution is seen in figure [ ] follows: 48.81 50 47.03 38 23.24 25 19.64 19.05 18.45 18.45 18.38 13.51 11.9 13 10.27 7.57 0 Asthma Blood Pressure Cancer Insured Diabetes Uninsured Heart Disease Others Of those suffering from any pre-existing diseases, 40% have undertaken medical expenses, on average up to INR 10220 in the last on year. The prevalence of diseases is biased towards “others”. The occurrence of lifestyle diseases (Blood Pressure, Diabetes, and Heart Disease) is low in this age group. ? www.policyadvisor.in www.cpc-analytics.com Page ? of ? 6 15
? ? Of the people interested in health insurance, 40% belong in the 30-40 age group. Have Diseases Healthy With Health Insurance 22.95% 77.05% Without Health Insurance 6.22% 94.78% Table 3: Insurance- Disease Matrix in the 30-40 age group 22% of the population in this age group was looking to revise their existing health plan options. The existing cover on an average for this age group is INR 3.20 lacs. 76% of those who bought health insurance don’t already suffer from any diseases. Those with health insurance who have a disease (23%) follow the distribution given in Figure []. For individuals with diseases seeking to revise their health insurance plan, the average medical expenditure was around 1.62 lacs. The prevalence of diseases in this age group is given in the figure [] 50.0 46.92 42.93 37.5 32.98 28.53 25.59 25.0 22.75 19.43 14.69 12.04 12.5 9.16 6.64 6.54 0.0 Asthma Blood Pressure Cancer Diabetes Heart Disease Others Insured Uninsured ? www.policyadvisor.in www.cpc-analytics.com Page ? of ? 7 15
? ? 20% of those looking to buy health insurance belong in the 40-50 age group. The occurrence of diseases across both first time seekers of health insurance and those looking to revise their health insurance plans is given the matrix below. Have Diseases Healthy With Health Insurance 16.76% 83.24% Without Health Insurance 11.81% 88.19% Table 4: Insurance- Disease Matrix in the 40-50 age group 29% people in this age group already have an average health insurance cover of INR 4.19 lacs. The occurrence of diseases in this age segment can be seen from the figure []. 57.5 60 48.89 45 35.36 32 30 21.59 15.5 15 9.5 7 6.5 6.35 4.44 3.49 0 Asthma Blood Pressure Cancer Diabetes Heart Disease Others Insured Uninsured The occurrence of diabetes and heart disease is higher for those seeking to revise their health insurance plan, while the occurrence of blood pressure and cancer is higher for first time seekers of health insurance. The average insurance cover for the insured in this age segment is INR 4.18 lacs. ? www.policyadvisor.in www.cpc-analytics.com Page ? of ? 8 15
? ? Of those looking to buy health insurance, 11 % fall in the 50-60 age group. Of those who don’t have health insurance, the average medical expenses amount to INR 207567. Have Diseases Healthy With Health Insurance 27% 73% Without Health Insurance 24% 76% Table 5: Insurance- Disease Matrix in the 50-60 age group More healthy people than unhealthy are insurance seekers. The prevalence of diseases in this age group in given in figure [] 59.57 60.0 56.67 43.06 45.0 39.89 30.0 16.49 15.56 15.0 11.7 11.67 6.39 6.38 4.44 2.13 0.0 Asthma Blood Pressure Cancer Diabetes Heart Disease Others Insured Uninsured Figure 6: Prevalence of diseases in the 50-60 age group The occurrence of diabetes, heart disease and cancer is more frequent for the population already insured, while the occurrence of asthma and blood pressure is higher for first time seekers of health insurance. In this age group, the average insurance cover purchased is INR 4.3 lacs. ? www.policyadvisor.in www.cpc-analytics.com Page ? of ? 9 15
? ? Among those looking to buy health insurance, 5% fall in the 60-70 age group. Within this group, the following distribution is seen: Have Diseases Healthy With Health Insurance 35.01% 64.99% Without Health Insurance 38.21% 61.79% Table 6: Insurance Disease Matrix in the 60-70 age group Among the insured in this age group, the prevalence of diseases is shown in figure []. The average amount of health insurance cover purchased is INR 335400 on an average. 70.0 62.4 61.21 56.47 52.5 47.2 35.0 20 18.53 17.5 10.78 8.8 3.02 2.59 1.6 1.6 0.0 Asthma Blood Pressure Cancer Diabetes Heart Disease Others Insured Uninsured ? Figure 6: Prevalence of diseases in the 60-70 age group While the occurrence of asthma, blood pressure, cancer and others is higher among those seeking to revise their health insurance plans, the occurrence of diabetes and heart disease is higher for first time insurance seekers. The average health expenditure for this group is INR 1.87 lacs. ? www.policyadvisor.in www.cpc-analytics.com Page ? 10 of ? 15
? ? Characteristics Segregated by City 73% of the people who showed interest in buying insurance belong to Tier I and Tier II cities. Among these, 65% belong to Tier I cities. Population from Tier I cities forms the majority among both Tier I & Tier II cities (65%). Their major characteristics are presented in the table []. Among the insured, the average insurance cover purchased is INR 3.6 lacs approximately. Have Diseases Healthy With Health Insurance 97.02% 2.98% Without Health Insurance 9.69% 90.30% Table 7: Insurance Disease Matrix in Tier I cities More people looking to buy insurance for their first time are married, as seen in figure 20, while those seeking to revise their health insurance plan belong to the married category. Married Single With Health Insurance 14.32% 85.67% Without Health Insurance 69.88% 30.12% Table 8: Insurance- Marital Status Matrix in Tier I cities Among those in these cities who already have health insurance, the following distribution of diseases is seen: 60.0 52.42 48.78 45.0 37.7 28.55 30.0 25.95 20.59 16.26 12.97 12.46 15.0 7.79 6.89 4.73 0.0 Asthma Blood Pressure Cancer Diabetes Heart Disease Others Insured Uninsured ? www.policyadvisor.in www.cpc-analytics.com Page ? 11 of ? 15
? ? In Tier II cities, the following distribution is seen: Have Diseases Healthy With Health Insurance 58.87% 41.13% Without Health Insurance 78.13% 21.87% Table 9: Insurance Disease Matrix in Tier II cities More people looking for health insurance in Tier II cities are married, as is sheen in the matrix below: Married Single With Health Insurance 87.40% 12.60% Without Health Insurance 77.06% 22.94% Table 10: Insurance- Marital Status Matrix in Tier II cities In Tier II cities, among the people already insured, the following distribution of diseases is seen: 50 47.28 45.61 36.58 38 28.91 25 21.38 20.75 15.99 13.61 13.3 13 7.14 6.89 6.89 0 Asthma Blood Pressure Cancer Diabetes Heart Disease Others Insured Uninsured ? www.policyadvisor.in www.cpc-analytics.com Page ? 12 of ? 15
? ? Characteristics Segregated by Income Income Group( 000 , Monthly) Insurance Cover ( in Lacs ) Medical Expenses( in Lacs ) Average 3.2 1.3 10-20 2.3 0.94 20-30 2.78 1.06 30-40 2.7 1.04 40-50 3.1 1.33 50-60 3 0.76 60-70 4.5 1.34 70-80 3.87 2.03 80-90 4.1 2.04 For people with income in the range of INR 10-20 thousand, the average insurance cover for the 16.4% of people who have insurance is INR 2.3 lacs. 70% of people looking to buy insurance in this income group are married, and 75% of those married are looking to buy insurance for their families as well. In contrast, 60% of those single are looking for insurance covers for themselves. In the income group INR 20-30 thousand, the average medical expenses is around INR 79 thousand. The average insurance cover in this segment in INR 2.78 lacs More married individuals seek to buy health insurance than single ones (58% of those who showed interest in purchasing health insurance were married). 62% of single individuals were seeking only to purchase insurance for themselves, while among those who are married, only 29% were looking to buy insurance just for themselves. For the next income group (INR 30-40 thousand), the average insurance cover is INR 2.7 lacs, while the average medical expense has been INR 10 thousand. 74% of the individuals in this segment were looking to buy insurance for their family members also. More of these individuals were married than single. ? www.policyadvisor.in www.cpc-analytics.com Page ? 13 of ? 15
? ? For higher levels of income (INR 40-50 thousand), the average insurance cover is INR 3.1 lacs, while the average medical expense is INR 1.4 lacs. More married people in this category look to buy insurance (84% applicants were married). Married individuals also looked to buy insurance for additional family members, to a greater extent. 83% of married individuals sought insurance protection for their families as well, as compared to the corresponding figure of 46% among the individuals who were not married. For people with income in the range of INR 50-60 thousand, the average insurance cover for the 25.57% of people who have insurance is INR 3 lacs. The average medical expenditure in this category for those who reported it is INR 1.13 lacs. 86.15% of people looking to buy insurance in this income group are married, and 80% of those married are looking to buy insurance for their families as well. In contrast, 31% of those single sought to buy insurance for their families as well. In the following income group (INR 60-70 thousand), the average insurance cover is INR 4.5 lacs, while the average medical expense (among those who reported it) has been INR 1 lacs. 86% of the individuals in this segment are married, and more of these individuals sought to buy insurance for their family members also (about 83%). Interestingly, among those who were single, 39% sought to buy insurance for their families. Among levels of income ranging from INR 70-80 thousand, the average insurance cover is INR 3.87 lacs, while the average medical expense is INR 77 thousand. More married people (than those who are single) in this category look to buy insurance (90% of those who sought insurance were married). Married individuals also looked to buy insurance for additional family members, to a greater extent. 80% of married individuals sought insurance protection for their families as well, as compared to the corresponding figure of 30% among the individuals who were not married. For people with income in the range of INR 80-90 thousand, the average insurance cover for the 30.51% of people who have insurance is INR 4.1 lacs. The average medical expenditure in this category for those who reported it is INR 2.5 lacs. 84.64% of people looking to buy insurance in this income group are married, and 80% of those married are looking to buy insurance for their families as well. In contrast, only 25% of those single sought to buy insurance for their families as well. ? www.policyadvisor.in www.cpc-analytics.com Page ? 14 of ? 15
? ? About the Online Health Advisor Tool The online health insurance tool helps customers to check if they need Health insurance and how much insurance cover they need before they compare and buy health insurance online. It’s a free tool & No Mobile/ Email or contact information is required. Research by : ? Sunmatic Technologies Private Limited Pune, India www.policyadvisor.in contact@policyadvisor.in Ph : 020-41208460 Analytics Partner : CPC Analytics, Berlin, Germany www.cpc-analytics.com v.kulkarni@cpc-analytics.com ? www.policyadvisor.in www.cpc-analytics.com Page ? 15 of ? 15