Download
1 / 34
340 likes | 344 Views
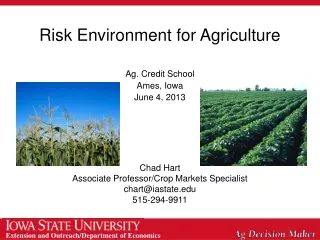
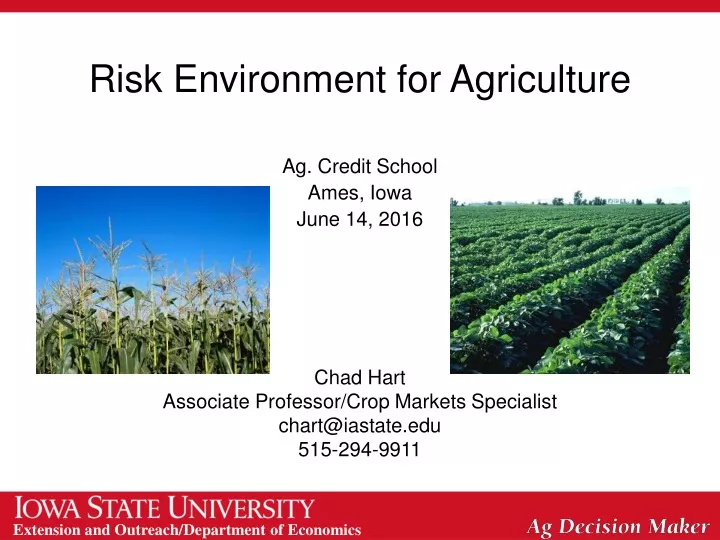
Risk Environment for Agriculture. Ag. Credit School Ames, Iowa June 14, 2016 Chad Hart Associate Professor/Crop Markets Specialist chart@iastate.edu 515-294-9911. Iowa Corn Prices vs. Costs. Iowa Soybean Prices vs. Costs. Iowa Corn Costs. Overall 52% increase. 72%. 18%. 54%. 27%.

E N D
Risk Environment for Agriculture Ag. Credit School Ames, Iowa June 14, 2016 Chad Hart Associate Professor/Crop Markets Specialist chart@iastate.edu 515-294-9911
Iowa Corn Costs Overall 52% increase 72% 18% 54% 27% Source: AgDM A1-21
Iowa Soybean Costs Overall 59% increase 72% 9% 51% 61% Source: AgDM A1-21
Crop Prices for the Next Decade Source: USDA-ERS
GDP Growth Source: USDA-ERS
U.S. Crude Oil Prices Source: USDA-ERS
World Corn Markets Source: USDA
Crop Insurance • One of many risk management strategies • Traditionally set up to protect farmers in times of low crop yields • Now offers coverage for low prices • Available on over 100 commodities
Corn Acres Insured in 2015 87% of all corn acres are insured
Soy Acres Insured in 2015 89% of all soybean acres are insured
PLC: Corn Payment Potential Reference Price = $3.70 per bushel Payment Yield = 150 bushels per acre Notes: PLC payments are made on 85% of base acres.
ARC-CO: 2015 Corn Revenue Guarantee Benchmark Revenue = $851.69 per acre ARC Revenue Guarantee = $732.45 per acre Notes: Revenue Guarantee equals 86% of Benchmark.
PLC pays, ARC does not Neither pay Both pay ARC pays, PLC does not
Margin Maneuvers • Negotiate lower land rental rates • Explore variety choice (seed cost vs. seed benefits) • Soil test and apply required fertilizer • Examine and control other input costs (pesticides, herbicides, etc.) • Be more aggressive marketing on rallies • May look to limit losses, as opposed to capture profits • Singles & doubles vs. Home run strategy
Margin Maneuvers • Fully utilize government programs • ARC-CO, PLC, crop insurance • Break price into futures and basis components to capture improvements in either • Put the pencil to paper and calculate storage benefits/costs • Will a traditional seasonal price swing cover storage costs? • What are futures prices telling you about storage opportunities now? • Remember, Rome wasn’t built in a day • It took us awhile to get into this situation and it will take awhile to get out.
Revenue Mix Source: USDA-ERS
Revenues vs. Costs Source: USDA-ERS
Farm Incomes Source: USDA-ERS
A Multi-dimensional Issue Source: Takle et. al., 2013
Communication is Key • With your clients and your supervisors • No one wants an unwelcome financial surprise • Fewer surprises mean fewer conversations with regulators • But it does require a few more conversations with clients
Understanding Clients • What’s a “typical” year for them look like? • Production • Cash flow • Marketing • How far are they along their career path? • Beginning • Mid-career • Transitioning out • Do you see changes in the farm or in the client? • Is the client willing to discuss the changes?
Summary Ag Stats Source: Federal Reserve of Chicago
Summary Ag Lending Stats Source: Federal Reserve of Chicago
Iowa Loans Source: Hanson, 2016, IDoB
Examiner Experience Source: Hanson, 2016, IDoB
Thank you for your time!Any questions?My web site:http://www.econ.iastate.edu/~chart/Iowa Farm Outlook:http://www.econ.iastate.edu/ifo/Ag Decision Maker:http://www.extension.iastate.edu/agdm/