Download
1 / 9
90 likes | 94 Views
This lecture covers testing hypotheses, chi-squared distributions, and tests based on univariate categorical data. It includes examples of testing for the goodness-of-fit, homogeneity of categorical variables, and comparing proportions of different populations.

E N D
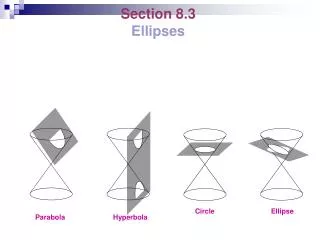
Lecture 18Section 8.3 Objectives: • Testing concerning hypotheses about a categorical population • Chi-squared distributions • Tests based on univariate categorical data • Testing for homogeneity of several categorical variables
Goodness-of-fit Test A factory produces marbles in the sizes small, medium, and large. A third of the marbles are supposed to be small, half of them medium, and a sixth are supposed to be large. Denote the observed value for the small size by O1, the observed value for medium by O2, and the observed value for large by O3. A simple random sample of 120 marbles from the factory contains O1=25 , O2=72 , and O3=23 . Is the observed distribution in the sample consistent with the theoretical distribution?
Goodness-of-fit Test The appropriate test for evaluating this claim is H0: π1=1/3, π2=1/2, π3=1/6 Ha: not all equalities hold in H0 where π1 denotes the proportion of small marbles, π2 the proportion of medium marbles, and π3 the proportion of large marbles produced by the factory. Denote the expected value for the small size by E1, the expected value for medium by E2, and the expected value for large by E3. From a sample of 120 marbles, what would be the expected number of small, medium and large marbles?
Goodness-of-fit Test How close are the observed values to the expected values? In our example X2 = 8.475. A large value of X2 is therefore considered evidence that the null hypothesis is not true. Is 8.475 a large value? How likely it is to obtain a value of X2 that is 8.475 or larger when the null hypothesis is in fact true.
Chi-Squared Distribution Test statistic X2 has approximately the chi-squared distribution with df = k−1 degrees of freedom, where k is the number of categories. The p-value of this test: p-value = Table VII gives the area under the χ2 curve to the right of the calculated X2 value. Find the p-value for the marbles example.
Example The U.S. Federal Bureau of Investigation (FBI) compiles data on crimes and crime rates and publishes the information in Crime in the United States. A violent crime is classified as by the FBI as murder, forcible rape, robbery, or aggravated assault. The following table provides a relative frequency distribution for the reported violent crimes in 1995. A random sample of 500 violent-crime reports from last year yielded the frequency distribution shown in the following table. Do the data provide sufficient evidence to conclude that last year's distribution of violent crimes has changed from the 1995 distribution?
Testing for Homogeneity of Several Categorical Variables Suppose that an investigator is interested in several different categorical populations or processes, each one consisting of the same categories. The investigator wishes to test whether the populations are homogeneous – the proportion in the first category is the same for all populations, the proportion in the second category is the same for all populations, and so on. The Chi-squared test for homogeneity of several categorical populations Denote the number of population by r and the number of categories for each population by k (the same k categories for all r populations). 1. State the Hypotheses: H0: the r populations are homogeneous with respect to the categories. Ha: the populations are not homogeneous.
Testing for Homogeneity of Several Categorical Variables 2. Calculate the test statistic The test statistic is, The chi-square statistic compares the observed cell counts with the expected cell counts given by Expected Cell Count Note1: If the expected counts and the observed counts are very different, a large value of X2 will result. Large values of X2 provide evidence against the null hypothesis. Note2: When all expected cell counts are at least 5, approx Approximately under H0.
Example A company packages a particular product in cans of three different sizes, each one using a different production line. Most cans conform to specifications, but a quality control engineer has identified the following reasons for non-conformance: 1. Blemish on can 2. Crack in can 3. Improper pull tab location 4. Pull tab missing 5. Other A sample of nonconforming units is selected from each of the three lines, and each unit is categorized according to reason for nonconformity, resulting in the following table. Does the data suggest that the proportions falling in the various conformance categories are not the same for the three lines?