Download
1 / 60
620 likes | 672 Views
Part 5: Queueing Models. Agenda. The Purpose Characteristics of Queues Systems Queueing Notations Long-Run Measures Steady-State Behavior of Infinite-Population Markovian Models Steady-State Behavior of Finite-Population Markovian Models Final Summary.

E N D
Agenda • The Purpose • Characteristics of Queues Systems • Queueing Notations • Long-Run Measures • Steady-State Behavior of Infinite-Population Markovian Models • Steady-State Behavior of Finite-Population Markovian Models • Final Summary
1. The Purpose (2) • Simulation is often used in the analysis of queueing models. • Queueing models provide the analyst with a powerful tool for designing and evaluating the performance of queueing systems. • Discuss some well-known models (NOT development of queueing theories) 3
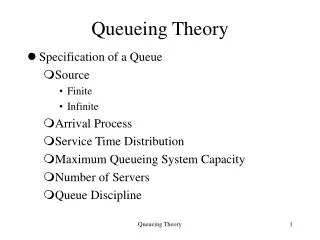
2. Characteristics of Queueing Systems (1): Key Elements Key elements of queueing systems: Customer: refers to anything that arrives at a facility and requires service, e.g., people, machines, trucks, emails. Server: refers to any resource that provides the requested service, e.g., repair persons, retrieval machines, runways at airport. Server(s) Waiting Line Customer Arrivals Service Times Service Mechanisms Calling Population Arrival Process System Capacity Queue Behavior Queue Discipline 4
2. Characteristics of Queueing Systems (2): Calling Population Calling population: the population of potential customers, may be assumed to be finite or infinite. Finite population model: if arrival rate depends on the number of customers being served and waiting, e.g., model of one corporate jet, if it is being repaired, the repair arrival rate becomes zero. Infinite population model: if arrival rate is not affected by the number of customers being served and waiting, e.g., systems with large population of potential customers. 5
2. Characteristics of Queueing Systems (3): System Capacity System Capacity: a limit on the number of customers that may be in the waiting line or system. Limited capacity, e.g., an automatic car wash only has room for 10 cars to wait in line to enter the mechanism. Unlimited capacity, e.g., concert ticket sales with no limit on the number of people allowed to wait to purchase tickets. 6
2. Characteristics of Queueing Systems (4): Arrival Process (1) For infinite-population models: Usually characterized in terms of inter-arrival times of successive customers. Arrivals may occur at random or scheduled times Random arrivals: inter-arrival times usually characterized by a probability distribution. Most important model: Poisson arrival process (with rate l), where An represents the inter-arrival time between customer n-1 and customer n, and is exponentially distributed (with mean 1/l). Scheduled arrivals: inter-arrival times can be constant or constant plus or minus a small random amount (jitter) to represent early or late arrivals. e.g., patients to a physician or scheduled airline flight arrivals to an airport. At least one customer is assumed to always be present, so the server is never idle, e.g., sufficient raw material for a machine. 7
2. Characteristics of Queueing Systems (4): Arrival Process (2) For finite-population models: Define customer as “pending” when the customer is outside the queueing system, e.g., machine-repair problem: a machine is “pending” when it is operating, it becomes “not pending” the instant it demands service form the repairman. Define “runtime” of a customer as the length of time from departure from the queueing system until that customer’s next arrival to the queue, e.g., machine-repair problem, machines are customers and a runtime is time to failure. Let A1(i), A2(i), … be the successive runtimes of customer i, and S1(i), S2(i) be the corresponding successive system times: that is Sn(i) is the total time spent in the system by customer i during the nth visit. 8
2. Characteristics of Queueing Systems (4): Arrival Process (3) Finite Population Models The total arrival process is the superposition of the arrival times of all customers. One important application of finite models is the machine-repair problem. Machines are the customers and runtime is time to failure. When a machine fails, it “arrives” at the queueing system and remains there until it is served. Time to failure is chracterized by exponential, Weibull and Gamma distributions. 9
2. Characteristics of Queueing Systems (5): Queue Behavior and Queue Discipline Queue behavior: refers to the actions of customers while in a queue waiting for service to begin, for example: Balk: leave when they see that the line is too long, Renege: leave after being in the line when its moving too slowly, Jockey: move from one line to a shorter line. Queue discipline: refers to the logical ordering of customers in a queue that determines which customer is chosen for service when a server becomes free, for example: First-in-first-out (FIFO) Last-in-first-out (LIFO) Service in random order (SIRO) Shortest processing time first (SPT) Service according to priority (PR). (e.g., type, class, priority) 10
2. Characteristics of Queueing Systems (6): Service Times and Service Mechanism (1) Service times of successive arrivals are denoted by S1, S2, S3, …… May be constant or random. {S1, S2, S3, …} is usually characterized as a sequence of independent and identically distributed random variables, e.g., exponential, Weibull, gamma, lognormal, and truncated normal distribution. Sometimes, services are identically distributed for all customers of a given type or class or priority, where as customers of different types might have completely different service-time distributions In some systems, service times depend upon the time of the day or upon the length of waiting line (e.g., servers might work faster than usual if waiting times are long, effectively reducing service times) 11
2. Characteristics of Queueing Systems (6): Service Times and Service Mechanism (2) A queueing system consists of a number of service centers and interconnected queues. Each service center consists of some number of servers, c, working in parallel upon getting to the head of the line, a customer takes the 1st available server. Parallel service mechanisms are either single server (c=1), multiple server (1<c<), or unlimited servers (c=) A self service facility is usually characterized by an unlimited number of servers 12
2. Characteristics of Queueing Systems (6): Service Times and Service Mechanism (3) Example: consider a discount warehouse where customers may: Serve themselves before paying at the cashier: 13
2. Characteristics of Queueing Systems (6): Service Times and Service Mechanism (4) Wait for one of the three clerks: Batch service (a server serving several customers simultaneously, e.g., small orders), or customer requires several servers simultaneously (e.g., big order or heavy item). 14
3. Queueing Notation (1) Recognizing the diversity of queueing systems, Kendall proposed a notational system in 1953 that has been widely adopted. A notation system for parallel server queues: A/B/c/N/K A represents the inter-arrival-time distribution, B represents the service-time distribution, c represents the number of parallel servers, N represents the system capacity, K represents the size of the calling population. Common symbols for A and B include M (exponential), D (constant or deterministic), Ek (for Erlang order k), PH (Phase-type), H (hyper-exponential), G (arbitrary or general), and GI (general independent). 15
3. Queueing Notation (2) Examples: M/M/1 (also M/M/1//) indicates a single-server that has unlimited queue capacity and an infinite population model. The interarrivals and service times are exponentially distributed. When N and K are infinite, they are often dropped from the notation G/G/1/5/5 represents a queueing system with general (or arbitrary) inter-arrival and service distribution with single server, with a queue capacity of 5 and finite population model of size 5 General models are used to solve the queue system with no particular distribution in mind Very useful as the final results can be obtained by plugging in the values of specific distributions 16
3. Queueing Notation (3) Primary performance measures of queueing systems: Pn: steady-state probability of having n customers in system, Pn(t): probability of n customers in system at time t, l: arrival rate, le: effective arrival rate, m: service rate of one server, r: server utilization, An: inter-arrival time between customers n-1 and n Sn: service time of the nth arriving customer, Wn: total time spent in system by the nth arriving customer, WnQ: total time spent in the waiting line by customer n, L(t): the number of customers in system at time t, LQ(t): the number of customers in queue at time t, L: long-run time-average number of customers in system, LQ: long-run time-average number of customers in queue, w: long-run average time spent in system per customer, wQ: long-run average time spent in queue per customer. 17
4. Long-Run Measures (1): Time-Average Number in System L (1) Consider a queueing system over a period of time T, Let Ti denote the total time during [0,T] in which the system contained exactly i customers, the time-weighted-average number in a system is defined by: Consider the total area under the function is L(t), then, time-integrated-average is given by: These two expressions are always equal for any queueing system regardless of the number of servers, the queue discipline or any other circumstances 18
4. Long-Run Measures (1): Time-Average Number in System L (2) Many queueing systems exhibit long-run stability in terms of their average performance. For such systems, as time T gets large, the observed time-average number in the system approaches a limiting value L, called long-run time-average. The long-run time-average # in system L, with probability 1: The estimator is said to be strongly consistent for L. If simulation run length T is sufficiently long, the estimator becomes arbitrarily close to L. Unfortunately for T < , it depends on the initial condition at t=0. (Reason to do multiple simulation runs!!) 19
4. Long-Run Measures (2): Time-Average Number in Queue LQ (1) Similarly, if LQ(t) denotes the number of customers waiting in line and TiQdenotes the total time during [0,T] in which exactly i customers are waiting in line. Then, The time-weighted-average number in queue is: Here, is the observed time-average number of customers in waiting line from time 0 to T. LQ is the long-run time-average number waiting in line. 20
4. Long-Run Measures (2): Time-Average Number in Queue LQ (2) G/G/1/N/K example: consider the results from the queueing system (N > 4, K > 3). 21
4. Long-Run Measures (3): Average Time Spent in System Per Customer w (1) If we simulate the queueing system for a period, say T and then record the time each customer spends in the system during [0,T], say W1, W2, …., WN where N is the number of arrivals in [0,T]. The average time spent in system per customer, called the average system time, is: For stable systems: with probability 1, where w is called the long-run average system time.. If the system under consideration is the queue alone (with WiQtime customer i spends in the queue): 22
4. Long-Run Measures (3): Average Time Spent in System Per Customer w (2) G/G/1/N/K example (cont.): The average system time is: Assumptions are single server, FIFO queue discipline. Time spent in waiting line is: 23
4. Long-Run Measures (4): Little’s Law (1) Conservation equation (a.k.a. Little’s law) Holds for almost all queueing systems or subsystems (regardless of the number of servers, the queue discipline, or other special circumstances). G/G/1/N/K example (cont.): On average, one arrival every 4 time units and each arrival spends 4.6 time units in the system. Hence, at an arbitrary point in time, there is (1/4)(4.6) = 1.15 customers present on average. Average System time Average # in system Arrival rate 24
4. Long-Run Measures (4): Little’s Law (2) Total system time for all customers is given by the total area under the number in system function L(t). Therefore, Little’s Law 25
4. Long-Run Measures (5): Server Utilization (1) Definition: the proportion of time that a server is busy. Observed server utilization, , is defined over a specified time interval [0,T]. Long-run server utilization is r. For systems with long-run stability: 26
4. Long-Run Measures (5): Server Utilization (2) As per the above picture, the server utilization is 27
4. Long-Run Measures (5): Server Utilization (3) For G/G/1/∞/∞ queues: Any single-server queueing system with average arrival rate l customers per time unit, where average service time E(S) = 1/m time units or m is the average service rate, infinite queue capacity and calling population. Conservation equation, L = lw, can be applied. For a stable system, the average arrival rate to the server, ls, must be identical to l. The average number of customers in the server is: For a single-server case, the average number of customers being served at any arbitrary point in time is equal to server utilization!! What is this?? 28
4. Long-Run Measures (5): Server Utilization (4) The actual number of customers in the server subsystem is either 0 or 1 29
4. Long-Run Measures (5): Server Utilization (5) In general, for a single-server queue: For a single-server stable queue: The arrival rate l must be less than the service rate m; (l < m) For an unstable queue (l > m) The server is always busy Waiting line tend to grow in length at an average rate of (l -m) customers per time unit and long run average queue length is long-run server utilization is 1. 30
4. Long-Run Measures (5): Server Utilization (6) For G/G/c/∞/∞ queues: A system with c identical servers in parallel. Arrivals occur at a rate l and each server works at a rate m customers per time unit. If an arriving customer finds more than one server idle, the customer chooses a server without favoring any particular server. For systems in statistical equilibrium, the average number of busy servers, Ls, is: Ls, = lE(s) = l/m. The long-run average server utilization is: 31
4. Long-Run Measures (5): Server Utilization (7) Customers arrive at random to a license bureau at a rate of =50 customers per hour. Currently, there are 20 clerks, each serving =5 customers per hour on the average. Therefore, the long-run or steady state average utilization of a server is The average number of busy servers is: A typical clerk is busy only 50% of the time!! Can we decrease the number of servers?? For system to be stable, the number of servers must be Possibilities are c11, 12 etc 32
4. Long-Run Measures (5): Server Utilization vs. System Performance (8) System performance varies widely for a given utilization r. For example, a D/D/1 queue where E(A) = 1/l and E(S) = 1/m, where: L = r = l/m, w = E(S) = 1/m, LQ = WQ = 0. By varying l and m, server utilization can assume any value between 0 and 1. Yet there is never any line. In general, variability of inter-arrival and service times causes lines to fluctuate in length. 33
4. Long-Run Measures (5): Server Utilization vs. System Performance (9) Example: A physician who schedules patients every 10 minutes and spends Siminutes with the ith patient: Arrivals are deterministic, A1 = A2 = … = l-1 = 10. Services are stochastic, E(Si) = 9.3 min and V(Si) = 0.81 min2. On average, the physician's utilization = r = l/m = 0.93 < 1. Consider the system is simulated with service times: S1 = 9, S2 = 12, S3 = 9, S4 = 9, S5 = 9, …. The system becomes: The occurrence of a relatively long service time (S2 = 12) causes a waiting line to form temporarily. 34
4. Long-Run Measures (6): Costs in Queueing Problems Costs can be associated with various aspects of the waiting line or servers: System incurs a cost for each customer in the queue, say at a rate of $10 per hour per customer. The average cost per customer is: If customers per hour arrive (on average), the average cost per hour is: Server may also impose costs on the system, if a group of c parallel servers (1 £ c £ ∞) have utilization , each server imposes a cost of $5 per hour while busy. The total server cost is: $5*cr. WjQ is the time customer j spends in queue 35
5. Steady-State Behavior of Infinite-Population Markovian Models (1) Markovian models: exponential-distribution arrival process (mean arrival rate = l). Service times may be exponentially distributed (M) or arbitrary (G). A queueing system is in statistical equilibrium if the probability that the system is in a given state is not time dependent: P( L(t) = n ) = Pn(t) = Pn. Mathematical models in this chapter can be used to obtain approximate results even when the model assumptions do not strictly hold (as a rough guide). Simulation can be used for more refined analysis (more faithful representation for complex systems). 36
5. Steady-State Behavior of Infinite-Population Markovian Models (2) For the simple model studied in this chapter, the steady-state parameter, L, the time-average number of customers in the system is: Apply Little’s equation to the whole system and to the queue alone: G/G/c/∞/∞ example: to have a statistical equilibrium, a necessary and sufficient condition is l/(cm) < 1. 37
5. Steady-State Behavior of Infinite-Population Markovian Models (3): M/G/1 Queues (1) Single-server queues with Poisson arrivals & unlimited capacity. Suppose service times have mean 1/m and variance s2 and r = l/m < 1, the steady-state parameters of M/G/1 queue: 38
5. Steady-State Behavior of Infinite-Population Markovian Models (3): M/G/1 Queues (2) No simple expression for the steady-state probabilities P0, P1, … L – LQ = r is the time-average number of customers being served. Average length of queue, LQ, can be rewritten as: If l and m are held constant, LQ depends on the variability, s2, of the service times. 39
5. Steady-State Behavior of Infinite-Population Markovian Models (3): M/G/1 Queues (3) Example: Widget making machines malfunction at random and then require mechanic’s attention. Malfunctions occur according to a poisson process at a rate l = 1.5 per hour. Observation over several months has found that repair times by the single mechanic take an average time of 30 minutes with a standard deviation of 20 minutes. Therefore, the mean service time is 1/m = ½ =0.5 hour, the service rate m = 2 per hour and the variance s2 = 202 minutes = 1/9 hour. The customers are the widget makers and appropriate model is M/G/1 because only the mean and variance of the service times are known, not the distribution Therefore, =/=1.5/2 = 0.75. Steady state time average number of broken machines is: 40
5. Steady-State Behavior of Infinite-Population Markovian Models (3): M/G/1 Queues (4) Example: Two workers competing for a job, Able claims to be faster than Baker on average, but Baker claims to be more consistent, Poisson arrivals at rate l = 2 per hour (1/30 per minute). Able: 1/m = 24 minutes and s2 = 202 = 400 minutes2: The proportion of arrivals who find Able idle and thus experience no delay is P0 = 1-r = 1/5 = 20%. Baker: 1/m = 25 minutes and s2 = 22 = 4 minutes2: The proportion of arrivals who find Baker idle and thus experience no delay is P0 = 1-r = 1/6 = 16.7%. Although working faster on average, Able’s greater service variability results in an average queue length about 30% greater than Baker’s. 41
5. Steady-State Behavior of Infinite-Population Markovian Models (4): M/M/1 Queues (1) Suppose the service times in an M/G/1 queue are exponentially distributed with mean 1/m, then the variance is s2 = 1/m2. M/M/1 queue is a useful approximate model when service times have standard deviation approximately equal to their means. The steady-state parameters: 42
5. Steady-State Behavior of Infinite-Population Markovian Models (4): M/M/1 Queues (2) State transition diagram of M/M/1 queue k-1 k k+1 0 1 2 43
5. Steady-State Behavior of Infinite-Population Markovian Models (4): M/M/1 Queues (3) Solution for Pk The average number in the system M/M/1 1- (1-)2 Pk (1-)3 k L 44 1
M/M/1 Queues [Steady-State of Markovian Model] Example: M/M/1 queue with service rate m=10 customers per hour. Consider how L and w increase as arrival rate, l, increases from 5 to 8.64 by increments of 20%: If l/m³ 1, waiting lines tend to continually grow in length. Increase in average system time (w) and average number in system (L) is highly non-linear as a function of r. 45
5. Steady-State Behavior of Infinite-Population Markovian Models (4): M/M/1 Queues (4) Example: If arrivals are occurring at rate = 10 per hour. Management has a choice of two servers, one who works at rate 1=11 customers per hour and second at rate 2=12 customers per hour Respective utilizations are: 1=/1=10/11=0.909; 2=/2=10/12=0.833 Average number in the system is: L1= 1/(1- 1)=10; L2= 2/(1- 2)=5 Thus, a decrease in service rate from 12 to 11 customers per hour, a mere 8.3% decrease would result in an increase in average number in system from 5 to 10, which is 100% increase!!! 46
5. Steady-State Behavior of Infinite-Population Markovian Models (5): Effect of Utilization and Service Variability (1) For almost all queues, if lines are too long, they can be reduced by decreasing server utilization (r) or by decreasing the service time variability (s2). A measure of the variability of a distribution is coefficient of variation (cv): The larger cv is, the more variable is the distribution relative to its expected value For deterministic servers V(X)=0cv = 0 For exponential servers, E(X)=1/; V(X)=1/2 cv = 1; 47
5. Steady-State Behavior of Infinite-Population Markovian Models (5): Effect of Utilization and Service Variability (2) Consider LQ for any M/G/1 queue: Corrects the M/M/1 formula to account for a non-exponential service time dist’n LQ for M/M/1 queue 48
5. Steady-State Behavior of Infinite-Population Markovian Models (6): Multiserver Queue (1) M/M/c/∞/∞ queue: c channels operating in parallel. Each channel has an independent and identical exponential service-time distribution, with mean 1/m. To achieve statistical equilibrium, the offered load (l/m) must satisfy l/m < c, where l/(cm) = r is the server utilization. Some of the steady-state probabilities are given in terms of P0, the probability that the system is empty P(L()c) where L() is a random variable representing the number in the system in statistical equilibrium Implies the probability of all servers busy or 49