Download
1 / 41
410 likes | 815 Views
Evaluation Of The Tetraflex and Crystalens Accommodative IOLs Using the iTrace Aberrometer. Donald R. Sanders, M.D., PhD. David C. Brown M.D. Deepak Chitkara, M.B., ChB. D.O. Normal Accommodation – 30 Y/O Refraction Map. DISTANCE. NEAR. NEAR. DIFFERENCE.

E N D
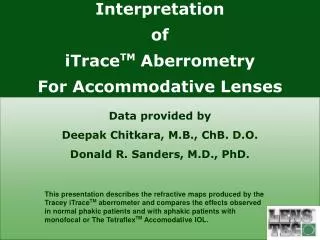
Evaluation Of The Tetraflex and Crystalens Accommodative IOLs Using the iTrace Aberrometer Donald R. Sanders, M.D., PhD. David C. Brown M.D. Deepak Chitkara, M.B., ChB. D.O.
Normal Accommodation – 30 Y/O Refraction Map DISTANCE NEAR NEAR DIFFERENCE
Normal Accommodation 3D Refraction Map (Tilted) DISTANCE NEAR DIFFERENCE
Normal Accommodation 3D Refraction Map (Vertical) DISTANCE NEAR DIFFERENCE
Normal Accommodation 3D Refraction Map (Vertical) DISTANCE Hyperopia Mean = +0.4D 1.2D Refractive Range Myopia
Normal Accommodation 3D Refraction Map (Vertical) NEAR Mean = -4.2D 3.5D Refractive Range
Normal Accommodation 3D Refraction Map (Vertical) DIFFERENCE Mean = -4.75D 2.4D Refractive Range
With Normal Accommodation and Near Focus • Refraction shifts to More Myopia • Refractive Range Increases
Monofocal IOL 3D Refraction Map (Vertical) DISTANCE NEAR DIFFERENCE
Monofocal IOL 3D Refraction Map (Vertical) DIFFERENCE No Refractive Difference 0.6D Refractive Range
MONOFOCALPSF @ 33 cm. ACCOMMODATIVE EFFORT DISTANCE NO DIFFERENCE IN PSF
MONOFOCALImage SimulationView @ 33 cm. ACCOMMODATIVE EFFORT DISTANCE NO DIFFERENCE IN IMAGE
Pupil Size Same for Distance & Near NEAR DISTANCE DIFFERENCE
Pupil Size Same for Distance & Near NEAR DISTANCE DIFFERENCE
Tetraflex in Other Eye 3D Refraction Map DISTANCE NEAR DIFFERENCE
Tetraflex in Other Eye 3D Refraction Map DISTANCE +2.8D 4.1D Refractive Range Mean = +1.6D -1.3D
Tetraflex in Other Eye 3D Refraction Map NEAR +3.8D Mean = +1.1D 8.6D Refractive Range -4.8D
Tetraflex in Other Eye 3D Refraction Map DIFFERENCE +1.1D 5.5D Refractive Range Mean = -0.4D -4.5D
TETRAFLEXPSF @ 33 cm. ACCOMMODATIVE EFFORT DISTANCE SUBSTANTIAL CHANGE IN PSF
TETRAFLEXImage SimulationView @ 33 cm. ACCOMMODATIVE EFFORT DISTANCE SUBSTANTIAL IMPROVEMENT IN NEAR
Tetraflex Accommodative IOL 3D Refraction Map DISTANCE NEAR DIFFERENCE
Tetraflex Accommodative IOL 3D Refraction Map DISTANCE 2.1D 1.9D Refractive Range Mean =+1.3D 0.2D
Tetraflex Accommodative IOL 3D Refraction Map NEAR 2.6D 5D Refractive Range Mean = +1.2D -2.4D
Tetraflex Accommodative IOL 3D Refraction Map DIFFERENCE 1.4D Mean = 0.1D 4.2D Refractive Range -2.8D
-3.8D -5.5D -5.2D Tetraflex Accommodative IOL 3D Refraction Map DISTANCE NEAR DIFFERENCE Widened Refractive Range and More Myopia at Near and in Difference Map
-3.5D -5.2D -3.1D Tetraflex Accommodative IOL 3D Refraction Map DISTANCE NEAR DIFFERENCE Widened Refractive Range and More Myopia at Near and in Difference Map
-0.6D -1.4D -2.1D Tetraflex Accommodative IOL 3D Refraction Map DISTANCE NEAR DIFFERENCE Widened Refractive Range and More Myopia at Near and in Difference Map
Summary The Tetraflex Accommodative IOL is associated with a widened refractive range and more myopia with near fixation, which can explain the enhanced near acuity compared to monofocal IOLs.
-3.5D -3.5D Patient AB – OD Crystalens3D Refraction Map NEAR DISTANCE DIFFERENCE
-2.3D Patient GB – OD Crystalens3D Refraction Map NEAR DISTANCE DIFFERENCE
Patient GB – OS Crystalens3D Refraction Map NEAR DISTANCE DIFFERENCE
-2.3D -2.8D Patient RC – OD Crystalens3D Refraction Map NEAR DISTANCE DIFFERENCE
Patient DB – OD Crystalens3D Refraction Map NEAR DISTANCE DIFFERENCE
Patient DB – OS Crystalens3D Refraction Map NEAR DISTANCE DIFFERENCE
-1.3D -1.4D Patient GF – OD Crystalens3D Refraction Map NEAR DISTANCE DIFFERENCE
-2.5D Patient PS – OS Crystalens3D Refraction Map NEAR DISTANCE DIFFERENCE
Patient ER – OD Crystalens3D Refraction Map NEAR DISTANCE DIFFERENCE
Patient ER – OS Crystalens3D Refraction Map NEAR DISTANCE DIFFERENCE
Patient BV – OD Crystalens3D Refraction Map NEAR DISTANCE DIFFERENCE
Patient MA – OS Crystalens3D Refraction Map NEAR DISTANCE DIFFERENCE
Summary The Crystalens Accommodative IOL is associated with a widened refractive range and more myopia with near fixation in some cases. In others no clear accommodative effect is obvious