Download
1 / 12
120 likes | 223 Views
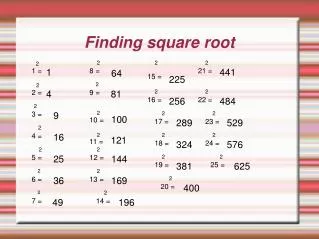
Reflections and the Square Root Curve. Lesson 4.5. The graph of the square root function, , is another parent function that you can use to illustrate transformations. From the graphs below, what are the domain and range of ?.

E N D
Reflections and the Square Root Curve Lesson 4.5
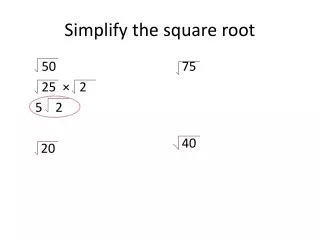
The graph of the square root function, , is another parent function that you can use to illustrate transformations. From the graphs below, what are the domain and range of ? Graph on your calculator. You can see that at x=3, f(x)≈ 1.732.
The graph of the square root function, , is another parent function that you can use to illustrate transformations. From the graphs below, what are the domain and range of ? What is the approximate value of at x = 8? What happens when you try to find f (x) for values of x < 0? How would you use the graph to find ?
Take a Moment to Reflect • In this investigation you first will work with linear functions to discover how to create a new transformation—a reflection. Then you will apply reflections to quadratic functions and square root functions.
Predict what the graph of -f1(x) will look like. Then check your prediction by graphing f2(x)= -f1(x). • b. Change f1 to f1(x)=-2x-4, and repeat the instructions in part a. • c. Change f1 to f1(x)=x2 +1 and repeat. • d. In general, how are the graphs of y=f(x) and y=-f (x) related? Graph on your calculator.
Predict what the graph of f1(-x) will look like. Then check your prediction by graphing f2(x)= f1(-x). • b. Change f1 to f1(x)=-2x-4, and repeat the instructions in part a. • c. Change f1 to f1(x)=x2 +1 and repeat. • Change f1 to f1(x)=(x-3)2+2 and repeat. Explain what happens. • In general, how are the graphs of y=f(x) and y=f (-x) related? Graph on your calculator.
Graph on your calculator. Predict what the graphs of f2 =- f1(x) and f3= f1(-x) will look like. Use your calculator to verify your predictions. Write equations for both of these functions in terms of x. Predict what the graph of f4 =-f1(-x) will look like. Use your calculator to verify your prediction. Notice that the graph of the square root function looks like half of a parabola. Why isn’t it an entire parabola? What function would you graph to complete the bottom half of the parabola?
Reflection of a Function • A reflection is a transformation that flips a graph across a line, creating a mirror image. • Given the graph of y=f(x), • the graph of y=f(-x) is a horizontal reflection across the y-axis, and • the graph of -y= f(x), or y=-f(x), is a vertical reflection across the x-axis.
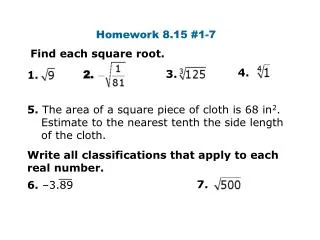
Example A piecewise function is a function that consists of two or more ordinary functions defined on different domains. Graph
Find an equation for the piecewise function pictured at right. For -4≤x≤0, the function appears to be equal to a reflection of the square root function about the y-axis and then shifted one unit up. This would be the function For 0<x≤3, the function appears to be equal to a reflection of the square curve reflected over the x-axis and then shifted one unit to the right and 2 units up.
Find an equation for the piecewise function pictured at right.