Download
1 / 25
270 likes | 411 Views
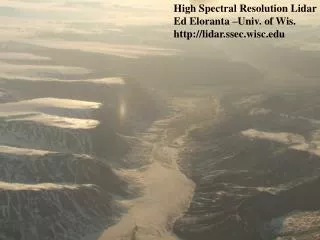
Tropospheric ozone variations revealed by high resolution lidar. M. J. Newchurch 1 , John Burris 2 , Shi Kuang 1 , Guanyu Huang 1 , Wesley Cantrell 1 , Lihua Wang 1 , Patrick I. Buckley 1 , Xiong Liu 3 , Debra Hopson 4 1 University of Alabama in Huntsville

E N D
Tropospheric ozone variations revealed by high resolution lidar M. J. Newchurch1, John Burris2, Shi Kuang1, Guanyu Huang1, Wesley Cantrell1, Lihua Wang1, Patrick I. Buckley1, Xiong Liu3, Debra Hopson4 1 University of Alabama in Huntsville 2 Goddard Space Flight Center, NASA 3Harvard Smithsonian Astrophysical Observatory 4 Huntsville Department of Natural Resources and Environmental Management The 3rd Asia Pacific Radiation Symposium Seoul, South Korea 25-28 August 2010
Introduction • High frequency of the ozone layer occurs in ozonesonde and Lidar profiles. • The ozone layer has high potential implications for a variety of dynamic, chemical atmospheric processes and energy budgets (Newell et. al,. 2001). • Due to their significance, dynamics and chemistry models should reproduce the ozone laminar structure(Stoller et al., 1999, Newell et al., 2001, Thouret et al., 2001). • However, we have little understanding of the mechanisms of ozone layers. (Stoller et al., 1999, Newell et al., 2001, Thouret et al., 2001). • In this study, we use two independent methods (Gradients and Wavelets) to study the mechanisms of ozone layer and its applications to models and satellite retrievals. The 3rd Asia Pacific Radiation Symposium Seoul, South Korea 25-28 August 2010 Hey!! 2
2007 3
Using Difference Quotients to Find Extreme Points of Ozone Profiles • Difference quotients are used to find extreme points of the mixing ratio. • Local minima and maxima are filtered through to distinguish significant layers based on the threshold percent difference value. • The threshold is defined as 15% difference between max and min. • A 3-point boxcar average is applied to data before difference quotients are applied. Huntsville Ozonesonde Data The 3rd Asia Pacific Radiation Symposium Seoul, South Korea 25-28 August 2010 Hey!! 4 4
Continuous Wavelet Transform(CWT) The CWT coefficient is defined as: a is the spatial extent or dilation of the function. b is the location at which the wavelet function is centered—the translation of the function. f(z) is the signal of interest, in this case, an ozone profile. and are the top and the bottom of the profile. means wavelet function. The 3rd Asia Pacific Radiation Symposium Seoul, South Korea 25-28 August 2010 5
CWT-Detected Layers from HSV Ozonesondes Where there is a large gradient in the profile, the absolute value of CWT coefficient will be large. Therefore, we use CWT to detect the upper and lower boundaries of the ozone layer. In order to delete the “noisy” layer, two thresholds are set: The max of these two should > 10.0% and the min should > 3.0%. is the max ozone mixing ratio (MR) within the layer. and are the ozone MR at the upper and lower boundaries of the layer. The 3rd Asia Pacific Radiation Symposium Seoul, South Korea 25-28 August 2010 6
Lidar and Ozonesonde Facilities used in this investigation Fairbanks Pellston Sable Island Trinidad Head Huntsville Houston The 3rd Asia Pacific Radiation Symposium Seoul, South Korea 25-28 August 2010 7
Seasonal Variations Occur in Altitudinal Distributions- Layer Height WRT to Tropopause Height Gradient Wavelet Spring Low frequency of layers near tropopause Summer High frequency of layers below tropopause Trinidad Head The 3rd Asia Pacific Radiation Symposium Seoul, South Korea 25-28 August 2010 8
Layer Characteristics Vary Between Locations-Layer Height WRT to Tropopause Height (Wavelet) The latitudinal trend of layer frequency below the tropopause is captured by both methods of analysis Decreasing Latitude Fairbanks (1996-1997, 2001; 64.86, -147.85) The frequency of layers above the tropopause decreases as latitude decreases; this is consistent for both methods as well Pellston (2004; 45.59, -84.7) The 3rd Asia Pacific Radiation Symposium Seoul, South Korea 25-28 August 2010 Sable Island (1997; 43.96, -60.05) Houston (2000; 29.75, -95.43 ) 9
Seasonal Peak Above Ground Level (Wavelets) Spring Summer Fall Winter Huntsville
Fine structure in the temporal variations of layer attributes can be quantified by Wavelet and Gradient methods from Lidar observations. Layer A Max-Min Max: 50.1 ppbv Min: 36.6 ppbv Mean max-min : 2.5 ppbv / 10min +7.9 ppbv / 10min -2.4 ppbv / 10min • Temporal variability from other layer attributes can be similarly quantified. • For example: O3 peak altitude, mixing ratio at peak. A B Layer B Thickness Max: 4.8 km Min: 3.0 km Mean Thickness: 0.3 km /10min +0.9 km /10min -0.3 km /10min 11
1. Intense STE (~500ppbv at 7km) to reach top of the PBL (~2km) within 48 hours The 3rd Asia Pacific Radiation Symposium Seoul, South Korea 25-28 August 2010 Hey!! 12
O3 lidar retrieval 500ppbv 10min, 500m resolution Cloud Cloud Cloud sonde Cold front passage, clouds at 4-6km sonde 13
Apr. 23, 2010 Apr. 27, 2010 May 1, 2010 Tropopause Dry stratospheric air Co-located ozonesonde measurements The 3rd Asia Pacific Radiation Symposium Seoul, South Korea 25-28 August 2010 Hey!! 14
NCEP NAM-WRF reanalysis data, relative humidity (RH) at 300hpa, 12Z Apr. 27, 2010 Dry air tongue Huntsville http://nomads.ncdc.noaa.gov/
NAM RH pressure-time cross-section above Huntsville 12Z 26 April~ 00Z 30 April, 2010 lat:34.73, long: -86.65 Dry air intrusion http://nomads.ncdc.noaa.gov/ 16
2. PBL ozone maximum due to post-front air stagnation. High surface ozone was also observed by the EPA station in Huntsville. The 3rd Asia Pacific Radiation Symposium Seoul, South Korea 25-28 August 2010 Hey!! 17
May 3, 2010 May 4, 2010 EPA surface O3 May 6, 2010 May 5, 2010 Sonde Decoupling of surface and residual layer May 7, 2010 Sonde, 1PM, May 8 The 3rd Asia Pacific Radiation Symposium Seoul, South Korea 25-28 August 2010 Hey!! 18
But canwe trust currentmodels? Vincent-Henri.Peuch@meteo.fr on behalf of the MAGEAQ consortium Current models, even run at high resolution (10km and below) tend to underestimate above surface horizontal and vertical gradients as well as variability. This is a fundamental concern in the context of a changing climate : to what extent can we assess future evolutions (Air Quality, regional-scale radiative forcings,…)? Ozone Lidar (CNRS) during the ESCOMPTE field Campaign (Marseilles area, summer 2001) MOCAGE (Météo-France) equivalent to Lidar observations
3. Correlation between ozone and aerosol The 3rd Asia Pacific Radiation Symposium Seoul, South Korea 25-28 August 2010 Hey!! 20
Positively correlated due to transport (from the same source) Oct. 4, 2008 Co-located wind profiler Low-level jet Aerosol ext.coeff. at 291nm from O3 DIAL Positively correlated due to transport Co-located ceilometer backscatter The 3rd Asia Pacific Radiation Symposium Seoul, South Korea 25-28 August 2010 Hey!! 21
Different variation structures for ozone and aerosol suggest local photochemistry dominates the ozone production Ozone mixing ratio, August 4, 2010 Diurnal variation Aerosol ext.n coeff. At 291nm from O3 DIAL The 3rd Asia Pacific Radiation Symposium Seoul, South Korea 25-28 August 2010 Hey!! 22
4. Potential for using lidar measurements to address ozone variability captured by satellite The 3rd Asia Pacific Radiation Symposium Seoul, South Korea 25-28 August 2010 Hey!! 23
Lidar observation, Aug. 4, 2010 Convolution of lidar ozone measurements between the surface and 10 km altitude at Huntsville, AL during August 4, 2010 with OMI ozone averaging kernel and a priori indicates that OMI is unable to capture the highly variable ozone structure in PBL, but captures a significant portion of the mid-tropospheric layer Lidar convolved with OMI kernel The 3rd Asia Pacific Radiation Symposium Seoul, South Korea 25-28 August 2010 Hey!! 24
Conclusions 1. High spatio-temporal ozone variations are associated with different dynamic and photochemical processes from PBL to upper troposphere. 2. The ozone variations and structures sometimes are closely correlated with aerosol and sometimes not. 3. Nocturnal residual ozone layers often exist decoupled from the surface. 4. The lidar observations will be very helpful for addressing the ozone variability captured by geostationary satellites and forecast with regional air-quality forecasts. The 3rd Asia Pacific Radiation Symposium Seoul, South Korea 25-28 August 2010 Hey!! 25