Download
1 / 12
120 likes | 241 Views
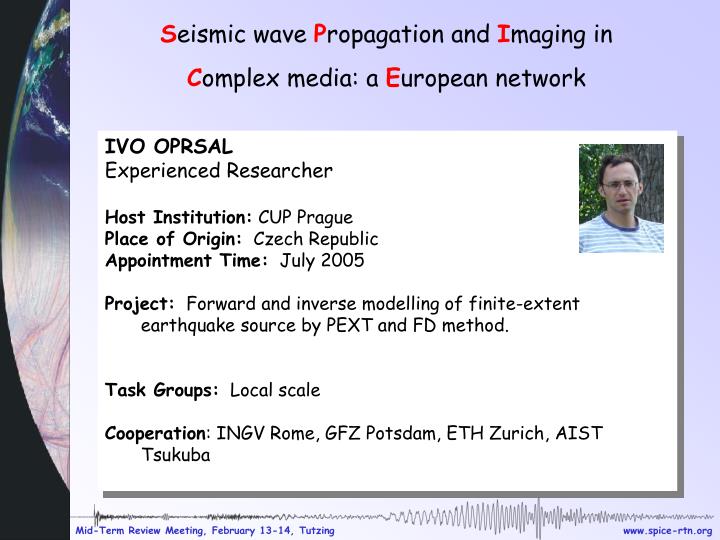
S eismic wave P ropagation and I maging in C omplex media: a E uropean network. IVO OPRSAL Experienced Researcher Host Institution: CUP Prague Place of Origin: Czech Republic Appointment Time: July 2005

E N D
Seismic wave Propagation and Imaging in Complex media: a European network • IVO OPRSAL • Experienced Researcher • Host Institution: CUP Prague • Place of Origin: Czech Republic • Appointment Time: July 2005 • Project: Forward and inverse modelling of finite-extent earthquake source by PEXT and FD method. • Task Groups: Local scale • Cooperation: INGV Rome, GFZ Potsdam, ETH Zurich, AIST Tsukuba
Project ScopeKinematic finite-extent source modellingThe Turkey-Flat strong motion "blind" prediction - internationalexperiment The Turkey Flat strong-motion experiment is the forth of the blind prediction experiments, where the Prague group takes a part:- Turkey Flat (Parkfield) weak motion test (1987)- Ashigara valley (Odawara, 1992)- Hyogo-ke n Nanbu earthquake (aka Kobe EQ) (Yokohama, 1998)- 2004 Parkfield M6 earthquake (USA, 2006), The tests are conducted under ESG(Effects of surface geology working group of IASPEI/IAEE), the 2006 ESG meeting will take place in Grenoble. More about the present Turkey-Flat strong-motion test can be found at the California Geological Survey page www.quake.ca.gov/turkeyflat.htm
“Blind” Test Approach • Conduct high quality field and laboratory tests to characterize the geotechnical properties of the site • Collect high-quality measurements of ground response in sediment basin and bordering rock • Distribute only rock records and request predictions at basin recording sites • Release observed basin recordings of and compare with predictions
R2 V1 V2 R1 D2 D1 D3 Phase I : R1 predictions (required synthetics: R2,V1,V2,D1,D2,D3) Phase II: D3 predictions (required synthetics: R2,V1,V2,D1,D2)
Turkey Flat strong-motion prediction by the finite-extent source modelling Usual approach is to focus on local site effects while the excitation is represented by plane incident waves. We emphasise the source effect. The reason is that: Firstly, the studied stations (R2, V1, V2, D1, D2, D3) are inside or around a very shallow stiff-soil sedimentary valley (local effects can be treated using individual 1D models below each receiver). Secondly, the dimensions of the ruptured area (W x L = 15 x 40 km, M6) are too large to be approximated by a planar wave. Composite-source method using a non-uniform fault slip distribution (Ji, 2005) is applied to all stations.
Turkey Flat situation Turkey Flat San Andreas Fault - projection of ruptured area hypocenter
Turkey Flat strong-motion prediction by the finite-extent source modelling Free parameters of the source model are tuned by fitting the available acceleration time history and spectrum at R1 (reference rock site) Acceleration (m/s^2)
Turkey Flat strong-motion prediction by the finite-extent source modelling ADVANTAGE: Synthetics (0-40Hz) at the studied stations R2, V1, V2, D1, D2, D3 (with individual 1D models) are obtained with the same source model as that used for R1 i.e. realistic description of the incoming wave filed
Turkey Flat strong motion Prediction, PHASE II NO MORE WORK NEEDED ! Availability of D3 record did not require any additional change. This is an a posteriori justification of the approach
Outlook I Modelling the data for predicted stations after they are released and benchmarking/comparison to solutions of other modellers.
Outlook II Weakness of discussed approach:ground motion modelling was tested at 2 points only (R1, D3) Hence, general applicability of the source modelling will be tested using accelerograms from more CISN stations distributed around the fault.