Download
1 / 43
430 likes | 531 Views
THE CASE FOR ACTION on SMOKING &TOBACCO USE. 2014. Scale of the challenge Smoking attitudes and behaviour How do we reduce tobacco use? Delivery at local level. Scale of the challenge. Smoking is the leading cause of preventable death. HIV: 504. Traffic: 1,850. Alcohol: 6,669.

E N D
Scale of the challenge • Smoking attitudes and behaviour • How do we reduce tobacco use? • Delivery at local level
Smoking is the leading cause of preventable death HIV: 504 Traffic: 1,850 Alcohol: 6,669 Illegal drugs: 1,605 Suicide: 5,377 Smoking: 79,100 Obesity: 34,100
Deaths from the most common smoking-related diseases Total annual deaths = 79,100
21 23 22 16 19 21 17 17 19 Smoking prevalence in England • Prevalence was 19% in 2013. • Peaked at 45% in 1974. • Prevalence is substantially higher amongst lower socio-economic groups, people with a mental illness and certain ethnic groups. • Prevalence is lowest amongst higher income groups and those with higher levels of education.
The decline in smoking prevalence has stalled Note to customise this chart: Save this presentation to your computer Double click the chart to enter values for your region and your locality Local data can be found at http://www.lho.org.uk/viewResource.aspx?id=16649 Delete these instructions Save the revised presentation.
The financial cost of smoking Annual estimated costs of smoking to the individual and society This figures is the highest estimate and includes £9.5 billion in tax.
The local cost of smoking Annual estimated costs of smoking to the individual and the community Note to customise this chart: Double click on the chart to open the data sheet to input values for your locality. The example of Blackpool is used in this illustration. Open the Local Costs of Smoking spreadsheet to calculate the costs in your locality – instructions on how to use the spreadsheet' are contained within it. Paste the chart from the spreadsheet into this presentation. The spreadsheet also allows you to print off a handout to use with this presentation.
Smoking costs the local economy millions every year The annual cost of smoking in this local area (£millions) Note to customise this chart: Save this presentation on your computer Delete the sample chart Open the Local Costs of Smoking spreadsheet to calculate the costs in your locality – instructions on how to use the spreadsheet are contained within it Select a chart and paste it into this document The spreadsheet also allows you to print off a handout to use with this presentation.
Smoking not social status is the leadingcause of health inequalities Smokers from the highest social class have a lower life expectancy than non-smokers in the lowest social class 3.50 3.00 2.50 The life expectancy between rich and poor smokers is similar 2.00 Relative mortality Richer smokers have a lower life expectancy than poorer non-smokers 1.50 1.00 0.50 0.00 I+II IV+V Social Class Highest Lowest Male non-smokers Male smokers
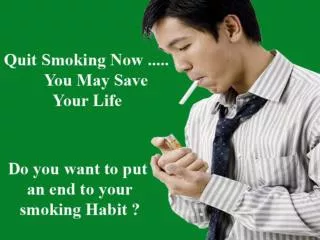
If we do nothing… Evidence and experience show that when anti-smoking campaigns cease, fewer adults are prompted to quit and more children start smoking. The impact is greatest amongst those on low incomes……
It is children not adults who take up smoking 90% of smokers started before the age of 19 18 is the age at which you can legally buy tobacco
Smoking Prevalence: Young People (11-15) 463 children take up smoking every day in England.
Children are three times more likely to start smoking if their parents smoke 99% of 16 year old regular smokers live in a household with at least one other smoker Smoking prevalence in 11-15 year olds by number of smokers they live with.
Where do children get their cigarettes from? Usual sources of cigarettes for 11-15 year olds in England
Smoking rates amongst pregnant teenagers are substantially higher than in other age groups
Women in low-paid work are 3 times more likely to smoke during pregnancy Socio-economic group: % who smoked before or during pregnancy
Every year nearly 10,000 children are treated in hospital for exposure to second-hand smoke
Smoking prevalence is higher in routine and manual groups
Smokers from lower socioeconomic groups are more likely to purchase illicit tobacco Illicit tobacco consumed by social group
How do we break the ‘cycle of smoking’ Protect families & communities Reduce the appeal and supply of tobacco Encourage more quit attempts each year Support quit attempts
The World Bank has developed a ‘six strand’ approach for reducing tobacco use • Stop the promotion of tobacco; • Make tobacco less affordable; • Effective regulation of tobacco products; • Help tobacco users to quit; • Reduce exposure to secondhand smoke; • Effective communications for tobacco control.
Local Authorities’ enforcement responsibilities include: Purchase of tobacco by under 18s Proxy sales Chewing and smokeless tobacco sales Smokefree legislation Illicit tobacco Shisha cafes Advertising ban
Local Authorities commission Stop Smoking Services NHS Stop Smoking Services are the most successful route to quit and the most cost effective NHS treatment there is
Smokers are nearly 4 times more likely to quit using NHS support than going ‘cold turkey’
Poorer smokers want to quit but are only half as likely to succeed Success rate in quitting by socio-economic class
Harm Reduction Nicotine is highly addictive. Some smokers are highly dependent on nicotine and: • may not be able (or want) to stop smoking in one step • may want to stop smoking but are unable to give up nicotine • may not be ready to stop smoking but want to reduce the amount they smoke. However it is the toxins in the tobacco smoke – not the nicotine – that cause illness and death.
The NICE approach to harm reduction For highly addicted smokers, NICE recommends a “harm reduction” approach which advocates either temporary or long-term substitution of tobacco with safer forms of nicotine: • Stopping smoking, but using NRT to prevent relapse. • Cutting down prior to stopping smoking with or without the help of NRT. • Smoking reduction with or without the use of NRT. • Temporary abstinence from smoking with or without the use of NRT.
Since the introduction of smokefree legislation, more people are making their homes smokefree Percentage of adults reporting that their homes are smokefree
There is strong public support for tobacco control measures NB You can replace this chart with regional data produced with this toolkit.
Health cost of smoking in your area Note to customise this chart: Values for your locality are calculated in the 'Local Tobacco Profiles' Copy from the ‘pdf’ as this provides the clearest image. Due to the amount of detail on this slide, a printed “handout” will probably be necessary for your audience.
Tobacco industry attempts to influence policy at local level. • The tobacco industry has a long history of using front groups to influence the policy process and undermine tobacco control measures. • The Tobacco Control Plan for England states explicitly that local government should take action to protect their public health policies from the interests of the tobacco industry. • Front groups may claim to represent shopkeepers, retailers and publicans but in fact promote the interests of the tobacco industry. • Now that Local Authorities are responsible for public health, it is likely that the tobacco industry representations to Councils via these groups will increase.
Things to look out for…. • In 2013 the tobacco industry subsidiary “Nicoventures” attempted to meet with local authorities to discuss the implementation of the NICE guidance on harm reduction. • Planting stories with exaggerated claims about the impact of illicit tobacco sales in local press. • “Responsible Retailer” programmes purporting to address underage sales. • Offers to fund sniffer dogs, scanners and other “resources” for combating illicit tobacco. • Funding conferences for local government officers.
Working together for better health • Local Government, inc. police & fire brigade • Local Health Services • Organisations that work across neighbouring localities within a region • Employers • Voluntary sector organisations • Children’s and youth groups • Smokers (particularly, groups with high rates of smoking e.g. routine & manual smokers) • Health commissioners
Benefits of working across local boundaries • Marketing – would it be more cost effective to split marketing costs with other Local Authorities? • Tackling illicit tobacco – criminal gangs don’t pay attention to local government boundaries. • Surveys, research & data collection – cost savings can be had from collectively commissioning research & surveys, and sharing the results.
Key messages • Local Authorities have a key role to play: the NHS cannot reduce smoking rates alone. • Smoking is the single biggest preventable cause of health inequalities: reducing rates will bring significant improvements in health as well as cost savings. • To reduce smoking we need to increase the number of quit attempts & the success of each attempt: we should target the poorest smokers to narrow the gap in life expectancy between the richest & poorest and improve the health of the poorest, fastest