Download
1 / 44
440 likes | 557 Views
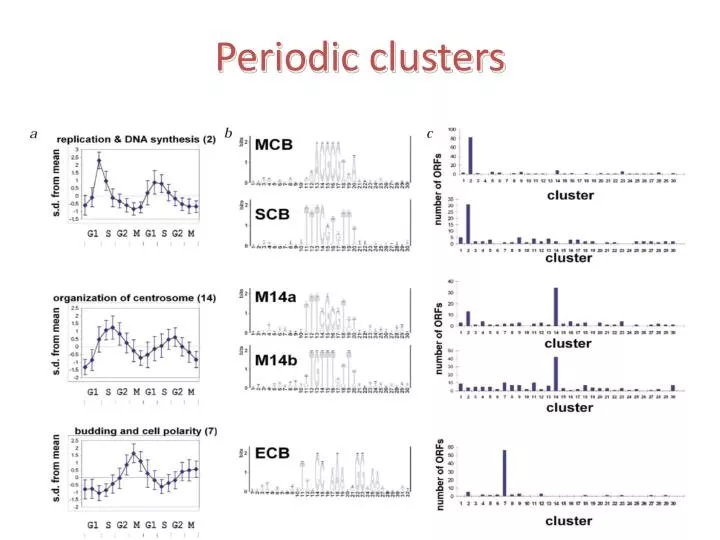
Periodic clusters. Non periodic clusters. That was only the beginning…. The human cell cycle . G1-Phase. S-Phase. G2-Phase. M-Phase. 4 3 2 1 0 -1 -2 -3 -4. Gene Expression. All genes Proliferation genes. G2/M G1/S CHR . Proportion.

E N D
The human cell cycle G1-Phase S-Phase G2-Phase M-Phase
4 3 2 1 0 -1 -2 -3 -4 Gene Expression All genes Proliferation genes G2/M G1/S CHR Proportion 5 10 15 20 25 30 35 40 45 Samples The proliferation cluster genes are cell cycle periodic
CHR ELK1 CDE E2F NFY 200 150 100 50 TSS The cell cycle motifs are enriched among the periodic genes Not in the cluster, mutated in cancer Tabach et al. Mol Sys Biol2005
Potential regulatory motifs in 3’ UTRs Finding 3’ UTRs elements associated with high/low transcript stability (in yeast) Entire genome AAGCTTCC CCTACAAC
Reverse the inference flow Motif finding Clustering Expression Time/tissues Diagnosing motifs using expression
Once we reverse the inference order we can • Enumerate and score all possible k-mer motifs • Examine the effect of “mutations” on motifs • Examine the effect of motif location within promoter • Examine the effect of motif combinations, distances within a combination • More?
…But the correlation between gene • cluster and motifs is imprecise in both directions: • there are genes in the cluster without the motif • and many genes with the motif do not • respond. • If gene control is multifactorial, groups of genes defined by a common motif will not be mutually disjointed • partitioning • the data into disjoint clusters will cause loss of information.
A k-mer enumeration method: score every possible k-mer for an association with expression level Ag is expression level of gene g C is a basal expression level (same for all gs) The integer Nμgequals the number of occurrences of motif μ in gene g M a set of motifs Fμ is the increase/decrease in expression level caused by the presence of motif μ (same for all gs)
EC score = 0.05 Expression level Time EC score = 0.5 Expression level Time Motifs characterization through Expression Coherence (EC) ScanACE (Hughes et al.)
Expression coherence score, intuition 1 2 * * EC1=0 EC2=0.66 * * * * * * * * * 3 4 * * * * * * * * * * * * * * EC3=0.2 EC4=0.2 * * * * * * Threshold distance, D
Interaction of motifs M1 AND M2 Expression level G2 G2 Only M1 Only M2 Expression level M2 M1
Synergistic motifs A combination of two motifs is called ‘synergistic’ if the expression coherence score of the genes that have the two motifs is significantly higher than the scores of the genes that have either of the motifs Mcm1 SFF
A global map of combinatorial expression control Pilpel et al. Nature Genetics 2001 *High connectivity *Hubs *Alternative partners in various conditions
Necessity Sufficiency Hierarchy TF-TF interaction Ho et al. Nature. 2002 Deduced network Properties - 1 - 0 . 5 . Correlation 0 0 . 5 G 2 G 1 1 M bp 1 M C B M S E Ndt80 U R S 1 Ume6 S C B Swi4 M C M 1 ' M C M 1 ' S F F ' Fkh1 0 . 2 0 . 4 Expression Coherence 0 . 6 0 . 8
Distance and orientation of motifs affect expression profiles ATG ATG ATG ATG ATG ATG
A Bayesian approach (conditional probability) • Xi could “1” to denote denote: • The presences of motif m • It’s distance from TSS is < N • It’s on the coding strand • It neighbors another motif m’ • Or “0” otherwise ei = being expressed in patter i
Example: two rRNA processing motifs The two motifs Work together The two motifs’ orientation matters
The procedure • Given that P(N|D)=P(N)*P(D|N) / P(D): • Search in the space of possible Ns to look for a one that maximizes the above probability • Impossible to enumerate all possible networks • Use cross validation: partition the data into 5 gene sets, learn the rules based on all but one and test based on the left-out, each time.
For example: what does it take to belong to expression patter (4)? • Need to have RRPE and PAC • If PAC is not within 140 bps from ATG , but RRPE is within 240 bps then the probability of pattern 4 is 22% • If PAC is within 140 and RRPE is within 240 bp then 100% chance
Inferring various logical conditions (“gates”) on motif combinations
The Bayesian network predicts very accurately expression profiles
S. Cerevisiae S. mikatae, S. kudriavzevii, S. bayanus). S. castellii S. Kluyveri Their intergenic sequences average 59 to 67% identity to their S. cerevisiaeorthologsin global Alignments S. castelliiand S. Kluyveri ~40% identity to Cerevisae
Nucleotide conservation in promoters is highest close to the TSS TATA-containing genes All genes
? ? ? ? ?
The data • Examined intergenic regions of human mouse rate and dog • ~18,000 genes • “Promoters”: 4kb centered on TSS • 3UTRs based on RNA annotations • 64 Mb, and 15 Mb in total respectively • Negative control: Introns of ~120 Mb • % of alignable sequence: • promoters: 51% (44% upstream and 58% downstream of the TSS), • 3’ UTR: 73%, • Introns:34%, • Entire genome: 28%
The phylogenetic trees • Questions: • How would addition of species affect analyses? • What if the sequences were not only mammalian?
An example: a known binding site of Err-a in the GABPA promoter • Questions: • What is the “meaning” of the other conserved positions?
Discovery of new motifs: exhaustive enumeration of all 6-mers
Discovery of new motifs: exhaustive enumeration of all 6-mers
Same methods to look for motifs in 3’ UTRs reveals strand-specific motifs