Download
1 / 30
300 likes | 478 Views
Academ y of Economics Studies Doctor al School of Finance and Banking. Estimating equilibrium exchange rate - FEER vs BEER -. MCs student: Ana Simona Manu Supervisor Professor: Mois ă Altăr. July, 2010. Dissertation paper outline. The importance of the equilibrium real exchange rate

E N D
Academy of Economics Studies Doctoral School of Finance and Banking Estimating equilibrium exchange rate- FEER vs BEER - MCs student: Ana Simona Manu Supervisor Professor: Moisă Altăr July, 2010
Dissertation paper outline • The importance of the equilibrium real exchange rate • The aims of the paper • Literature review • Economic foundation: FEER and BEER • Empirical evidence • Concluding remarks
The importance of the equilibrium real exchange rate • The stability of the exchange rate is an imperative condition for a country that aims to join the European Monetary Union while the competitiveness of an economy is a measure of the real convergence process. • The fulfillment of Maastricht criterion regarding the exchange rate stability depends on the optimal setting of the central parity consistent with the economic fundamentals • One important indicator of the price competitiveness of a country is represented by the real exchange rate misalignment towards its equilibrium values
The aims of the paper • Assessing the equilibrium exchange rate for the Romanian economy using two alternative approaches, respectively Fundamental Equilibrium Exchange Rate(FEER)andBehavioral Equilibrium Exchange Rate (BEER) • Evaluating the price competitiveness through real effective exchange rate (REER) misalignment using the two models • Calculating the nominal equilibrium exchange rate using bilateral EUR/RON exchange rate in an attempt to find an optimal central parity by applying the two methodologies • Comparing FEERs vs. BEERs results
Literature review • The first attempts to model equilibrium exchange rate are based on Purchasing Power Parity first developed by Gustav Cassel (1922),however the empirical evidence hardly validates this theory and only over the long term horizon. • In this context it became necessary to develop alternative approaches for modeling equilibrium exchange rate: • FEER: introduced by Williamson (1994) the equilibrium value is defined as that level of the exchange rate that assures simultaneous achievement of the internal and external balance • IMF macroeconomic balance approach used as a variant of FEER, which is based on a direct estimation of the sustainable level of the current account deficit considering the investment – savings relation • BEER: first introduced by Clark and MacDonald (1998), aims to asses the equilibrium exchange rate by using a more empirical approach based on fundamental variables affecting the evolution of the exchange rate on short and medium term. • for CEEC countries the most employed models are FEER and BEER adjusted to the particularities of transition countries ( note Egert and Lahrèche-Révil (2003), Bulir and Smidkova (2005), Michael Rubaszek studies on FEER)
Economic foundation of the modelsA. The FEER model • Determines the ERER consistent with both internal and external equilibrium • Internal equilibrium is usualy defined as that level of output consistent with full employment • External equilibrium is achieved when structural current account adjust to its norm/target level
Structural current account • It is defined as the level of the current account which is not affected by cyclical fluctuation of the explanatory variables • It is based on describing the external sector activity, respectively, the estimation of the exports/imports equations • It is computed by imposing internal equilibrium condition and accounting for exchange rate variations
The current account could be expressed based on the following equations: (1) (3) (4) (2) (5) (6)
Current account norm • For estimating the current account norm it was employed the methodology proposed by IMF researchers (Faruqee şi Debelle (1998), Masson (1998)), the key element of this approach consisting in defining the current account norm as the difference between saving and investment long term values. • Fiscal balance - positive relation, higher public spending triggering a lower level of national savings. • Demographic factors – negative relation, a higher level of population dependency ratio reduces savings and the current account balance., • Net foreign assets. – ambiguous effect, economies with high NFA can support higher level of current account deficits without having negative implication in terms of solvability, while a solid investment position triggers higher revenues from abroad improving the current account balance
The balance of fuel products - this variable is introduce in order to account for terms of trade shocks associated with oil prices. • The relative income per capita.It is expected that countries with lower level of capital to recall to external resources in order to finance the internal investments, triggering the deterioration of the current account. • Economic growth. A higher level of this indicator generates a higher current account deficit if the economic growth is fuelled by foreign investments or if it is perceived as being permanent, with a negative potential on saving ratio. • Foreign direct investments. The growth of foreign direct investments is associated with higher imports, having a negative impact on CC.
Fundamental equilibrium exchange rate Stylized figure • The exchange rate is expressed as units of foreign currency per unit of domestic currency, an increase of the indicator being equivalent with an appreciation • For a given level of output , the relation between the exchange rate and the current account is indirect, a depreciation leading to a deterioration of the current account • If the domestic output increases above the potential value, the curve will translate towards the left side, as we will have a permanent deterioration of the current account given the increase of imports • The equilibrium exchange rate is that level consistent with simultaneous achievement of internal and external equilibrium, both being impose exogenously. • This model gives us a trajectory of the ERER on medium term trough the adjustment of the current account trend to its norm value but it doesn’t capture the short term adjustment towards equilibrium value
Economic foundation of the modelsB. The BEER model • The observed level of the real exchange rate can be expressed as a function of its expected value and the real interest rate differential: • is an unobserved variable will be determined solely by a vector of fundamental economic variables which act on the medium and long term: • The empirical analysis considered testing the relation between the real exchange rate and variables like the productivity differential between the tradable and non-tradable sector of the economy, private and government consumption, the openness of an economy, net foreign assets, terms of trade: • Considering this framework, we can define the total misalignment as:
Empirical evidence1.The data • Quarterly data extracted from Eurostat, Bank of International Settlements, National Bank of Romania databases for the period 2000Q1- 2009Q4 (40 observations). First, all series were seasonally adjusted using Demetra software, developed by Eurostat. • It was used both effective and bilateral EUR/RON real exchange rate. The REER was extracted from the BIS database and is computed by using HICP as a deflator. The same method is applied in the case of bilateral EUR/RON real exchange rate. • all the variables are in constant prices (2000=100). • For determining current account norm it was employed a panel data analysis, the data sample comprising data from 5 countries (Romania, Hungary, Poland, Czech Republic and Bulgaria) for the period 2001Q1-2009Q4. The decision regarding the countries included in the analysis was motivated by the relatively similar characteristics of the countries given the geographic position and the development stage, while the choice of the period was conditioned by the data availability. The source of data is Eurostat database.
FEER empirical approach • This step consist in modelling the trade sector of Romanian economy by identifying long term relation for the considered variables. For this purpose I’ve employ a Engle Granger methodology • For estimating the cointegration equation we used the FMOLS estimator, as an alternative to static OLS, considering the significant errors that could appear given the reduce sample of data • The ADF and PP test are presented in Appendix 1 indicate that all the variables are I(1). All the estimated relations are cointegrated ones according to Engle-Granger tests (see Appendix 2)
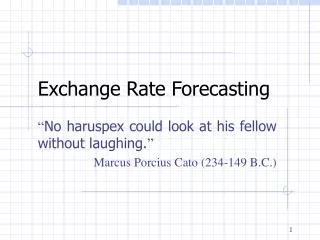
C h a r t 3 : T h e e v o l u t i o n t h e l a b o r p r o d u c t i v i t y t r e n d C h a r t 2 : T h e e v o l u t i o n o f d o m e s t i c d e m a n d t r e n d 1.5 50,000 45,000 1.4 40,000 1.3 35,000 1.2 30,000 1.1 25,000 1.0 20,000 0.9 15,000 2000 2001 2002 2003 2004 2005 2006 2007 2008 2009 2000 2001 2002 2003 2004 2005 2006 2007 2008 2009 W _ I N D W _ I N D _ H P _RO D D _ H P D D Internal equilibrium
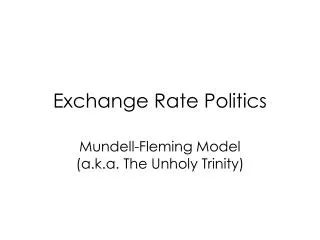
C h a r t 6 : A c t u a l c u r r e n t a c c o u n t v s s t r u c t u r a l c u r r e n t a c c o u n t 0 -2 -4 -6 -8 -10 -12 -14 -16 2000 2001 2002 2003 2004 2005 2006 2007 2008 2009 Current account _ Current account_structural _ _ Structural current account
Current account norm I’ve considered the fundamental variables presented in the theoretical part, the empirical evidence indicating the following statistical significant variables fiscal balance, GDP growth per capita, population growth, fuel products balance and direct foreign investment. Before running the regression all the variable were tested for unit root process, resulting that all variables are stationary (Appendix 3)
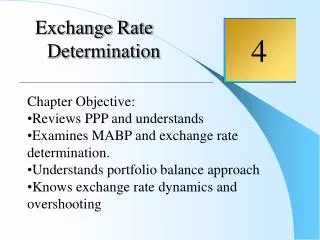
External equilibrium CC norm Structural CC The results indicates a current account norm between -8,5 percent of GDP at the beginning of the period and -7,45 percent at the end of 2009.
In the period 2001Q1-2009Q4 the misalignment of the REER from the equilibrium value varied between – 16,11 percent and 10,69 percent. • in 2001-2004 the REER was undervalued in average by 10 percent given that the structural current account deficit was lower then the current account deficit norm. • Starting 2005, once with the deterioration of the structural current account deficit, REER becomes overvalued, in order to restore the equilibrium being necessary a depreciation of REER between 1 and 10,7 percent. • This trajectory reversed at the end of the analyzed period, the excessive correction of the external position leading in 2009 to a level of REER slightly undervalued (-1,46 percent).
In the period 2001Q1-2009Q4 the misalignment of the RER_EUR from the equilibrium value varied between – 21,16 percent and 11,54 percent. • In 2001-2004 the degree of the RER_EUR undervaluation was in average with 2,45 percentage points lower then that associated with REER • In 2005-2008 the overvaluation of RER_EUR was in average with 0,9 percentage points higher than in the case REER.
there are no important changes in the periods of under/over valuation of the real exchange rate, but the magnitude of misalignment is significantly higher • In the case of REER the misalignment of the current values from the equilibrium increases in average with around 6 percentage points, while the RER_EUR misalignment is even more sensitive to this hypotheses, growing in average by 7,7 percentage points • towards the end of 2009 the sensitivity analysis indicate an equilibrium value around the actual value, and not an undervalued one
For period 2001q1-2009q4, the increase of elasticises by 10% implies a higher misalignment of REER in average with 1,5 pp. compared with the initial situation. • in 2001q1-2004q4 the level of undervaluation was lower with around 1pp. (of-9,15%) • 2005q1-2008q4 the level of overvaluation was higher in average with around 2 pp.(8,85 %) • The decrease of the elasticises by 10% triggered for the entirely analyzed period a lower level of REER misalignment in average with 1,8 pp. • for 2001q1-2004q4 the undervaluation is higher with 1,2 pp. (of -11, 3%), • for 2005q1-2008q4 it can be seen a lower level of the overvaluation with 2,3 pp.(4,62 %). • For the end of 2009 the sensitivity analysis indicates that the REER undervaluation is between 3 and 8 percent.
BEER empirical approach • is based on the estimation of a long term equilibrium relation between the real exchange rate and the fundamental variables: REER, net foreign liabilities, relative price of non-tradables versus tradables, terms of trade • It were performed ADF and PP tests (Appendix 5) showing that all the variables have a unit root. • The first step in implementing Johansen 's test consists in the estimation of a VAR model with a number of lags determined by the information criteria.. The quality test of VAR are presented in Appendix 6.
The cointegrating relationship is given by: log(REER)= -0,1623*log(NFL) +0,8803*log(TNT) +1,9739*log(TOT) + 0.507370 (0.0493)(0.1234) (0.029) [3.2939] [-7.1334] [14.8208] • The equilibrium exchange rate was obtained by filtering the explicative variables • REER misalignment in the 2001Q1-2009Q4 period varies between -9,9 per cent and 13,9 per cent. • at the beginning of the analyzed period, REER was around its equilibrium value • starting with 2002, REER becomes clearly undervalued with a maximum misalignment in 2004Q2. • In the 2005Q1-2008Q4 period , the overvaluation of REER was on average 5,9 per cent • In 2009Q4 we can observe an undervaluation of 1,51 per cent.
BEER vs FEER • Important differences between the two approaches appear only at the beginning of the analyzed period • The FEER model indicates an equilibrium real exchange rate more appreciated by an average of 15 pp. 2001Q1-2002Q4. This is mainly due to significantly lower CA deficit than the one supported by the norm level as indicated by fundamental values of savings and investments (structural CA was on average -5,72% of GDP compared to a 8,4% deficit supported by the CA norm) • The modified hypothesis of a lower sustainable current account deficit by a single percentage point (to -7,4%) leads to significantly lower gaps between the misalignments predicted by FEER and BEER. • Starting with 2003, given the rise of the structural deficit, the undervaluation for REER indicated by FEER was reduced, with an average gap over the level indicated by BEER of 5,82 per cent on average (2003Q1-2004Q4). • FEER and BEER indicate for the 2005-2008 period an overvaluation for the real exchange rate, with an average misalignment of 6,92% for the fundamental approach and one of 5,94% for the behavioral one. The maximum misalignment was 10,7 per cent as indicated by FEER and 13,9% as pointed by BEER • In 2009, it can be observed an undervaluation for REER with a misalignment of 1,46% (FEER) or 2,56% (BEER)
According to FEER, in Q4 2009 the EUR/RON equilibrium value was around 4,02 RON/EUR while BEER indicates 4,17 RON/EUR
Concluding remarks • The equilibrium real exchange rate, a fundamental indicator when judging the competitiveness of an economy and its ability to match the nominal convergence criteria was assessed using the method of fundamental equilibrium exchange rate (FEER) and of behavioural equilibrium real exchange rate (BEER) • Both FEER and BEER models revealed the same three periods in the evolution of the real exchange rate misalignment towards equilibrium • The sensitivity analysis performed on the FEER model revealed that the results are more sensitive to the hypothesis of the structural current account than the one related to export/import elasticises. • The assessment of the equilibrium real exchange rate is also useful in the determination of the nominal equilibrium exchange rate. According to FEER method the in last quarter of 2009 the nominal equilibrium exchange rate was 4,02 while BEER suggests an equilibrium value of 4, 17. • In this context, for transition countries, BEER and FEER should be used as complementary methodologies rather then substitutable