Download
1 / 31
310 likes | 396 Views
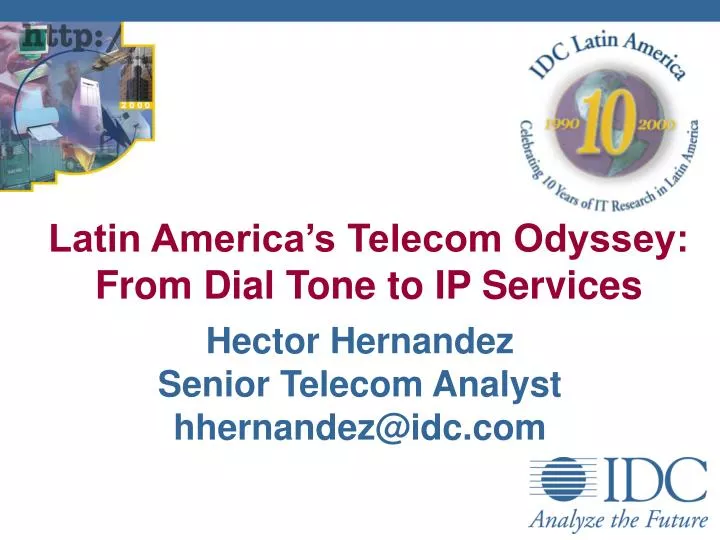
Latin America’s Telecom Odyssey: From Dial Tone to IP Services. Hector Hernandez Senior Telecom Analyst hhernandez@idc.com. Agenda. Definitions and Methodology Latin America’s Traditional Long Distance Market Overview Latin America’s IP Long Distance Telephony Market Overview

E N D
Latin America’s Telecom Odyssey: From Dial Tone to IP Services Hector Hernandez Senior Telecom Analyst hhernandez@idc.com
Agenda • Definitions and Methodology • Latin America’s Traditional Long Distance Market Overview • Latin America’s IP Long Distance Telephony Market Overview • IP Long Distance Market Drivers and Inhibitors • Future Trends • The Next Steps
Traditional Long Distance Service IP Telephony PC to PC calls PC to Phone calls Phone to Phone calls Wholesale Market Retail Market Web Talk Click-to-talk Conferencing Messaging IP Telephony IP Telephony in Latin America Definitions
IP Telephony in Latin America Methodology • In-country interviews with: • Incumbent operators • Next generation providers • Competitive exchange providers • Local Internet telephony service providers (ITSPs) • Regional interviews with: • Traditional telephony carriers • Global Internet telephony service providers (ITSPs) • IP telephony equipment vendors
Latin America’s Long Distance Market Study Preliminary Results
Latin America’s Domestic Long Distance Markets, 1999: Quite Predictable (US$ Millions) 45,000 45% Revenues 40,000 51% Traffic 35,000 $4,427 30,000 23% Traffic Traffic (Billions of Minutes) $3,008 25,000 20,000 28% Revenues 15,000 $670 $1,359 10,000 $453 $228 $507 5,000 - Market Revenues (US$ Billions) Argentina Brazil Chile Colombia Mexico Venezuela Other ELAM Total Market Value: US$10.6 Billion
Latin America Traditional International Long Distance Market Revenues 1999: Not Your Usual Suspect 1999 Market Revenues (US$ Millions) 8,000 $1,759 7,000 52.3% Traffic 42% Revenues 6,000 5,000 52.3% Traffic 42% Revenues 20% Revenues 20% Traffic Traffic (Billions of Minutes) 4,000 3,000 $538 $833.29 2,000 $462 $194 1,000 $113 $266 - Market Revenues (US$ Billions) 53% Revenues Argentina Brazil Chile Colombia Mexico Venezuela Other ELAM Total Market Value: US$4.1 Billion Source: IDC’s Latin America Telecommunications Continuous Information Service, 2000
100,000 $0.18 90,000 $0.16 $0.17 $0.16 80,000 $0.14 70,000 $0.14 $0.12 60,000 $0.12 $0.10 $0.11 Six-Country Domestic Long Distance (Millions of Minutes) Average Price per Minute (US$) 50,000 $0.10 $0.08 40,000 $0.06 30,000 $0.04 20,000 $0.02 10,000 - $- 1999 2000 2001 2002 2003 2004 Six-Country Traditional Domestic Long Distance Market Forecast: A Price War CAGR -13% CAGR 7%
Six-Country Traditional International Long Distance Market Forecast 30,000 $0.50 $0.45 CAGR -24% $0.46 25,000 $0.40 $0.41 $0.35 20,000 $0.35 $0.30 $0.31 Six-Country International Long Distance (Millions of Minutes) Average Price per Minute (US$) $0.25 15,000 $0.28 $0.26 $0.20 10,000 $0.15 $0.10 5,000 CAGR 21% $0.05 - $- 1999 2000 2001 2002 2003 2004
120,000 30% 100,000 25% 80,000 20% Traditional DLD 60,000 15% IP DLD Domestic Long Distance Traffic (Millions of Minutes) IP as % of Total DLD 40,000 10% 20,000 5% - 0% 1999 2000 2001 2002 2003 2004 6-Country Domestic Long Distance: IP Arrives in 2001 • Driven by: • Efficiencies • Lower barriers to entry • Scaleability • Value Added Services • Unified Messaging • Click-to-talk • Hindered by: • Regulation • Competition from cellular, cable telephony, etc. 24% IP DLD CAGR 2000-2004 =443%
30,000 30% 25,000 25% 25.1% 20,000 20% Traditional ILD IP ILD 15% 15,000 (Millions of Minutes) International Long Distance Traffic IP as % of Total ILD 10,000 10% 5% 5,000 - 0% 1999 2000 2001 2002 2003 2004 6-Country International Long Distance: IP Anywhere • Driven by: • Arbitrage • Efficiencies (cost per call, lower bandwidth requirements) • Lower barriers to entry • Hindered by: • Regulation • Equipment Interoperability • QoS IP ILD CAGR 1999-2004 = 647%
160,000 30% Global IP MOU 140,000 25% 6-Country IP MOU 6-Country Percent of 120,000 Global IP Traffic 20% 100,000 15% 80,000 IP Traffic (Millions of Minutes) 60,000 10% 40,000 5% 20,000 - 0% 2004 1999 2000 2001 2002 2003 Global IP Telephony Market: The Opportunity • Driven by: • Arbitrage • Efficiency • Gain Market Share • Value Added Services • Unified Messaging • Web Talk • Hindered by: • Regulation • QoS • Equipment Interoperability Global IP CAGR 1999-2004 = 119% Source: IDC’s IP Telephony Services: Market Review and Forecast, 1998-2004.
Latin America’s IP Telephony Market Drivers Shift 2000-2004 ARBITRAGE ARBITRAGE EFFICIENCIES LOWER BARRIERS TO ENTRY EFFICIENCIES MARKET SHARE LOWER BARRIERS TO ENTRY VALUE ADDED SERVICES MARKET SHARE VALUE ADDED SERVICES YEAR 2000 YEAR 2004
Country 1 Launch Country 2 Launch Country 3 Launch Arbitrage Opportunity Latin America’s IP Telephony Market Drivers Arbitrage: Chasing the Opportunity IP/PSTN Price Gap Source: IDC’s IP Telephony Services in Europe, 1998-2003
Latin America’s IP Telephony Market Drivers • Arbitrage (origination Vs termination) Public Internet IP Gateway IP Gateway PSTN PSTN International Carrier System Settlement Rates Transport Costs Originated $$ Terminated
Latin America’s IP Telephony Market Drivers • Arbitrage Onnet Vs. Offnet Private Network SLA QoS IP Gateway IP Gateway PSTN PSTN International Carrier System Settlement Rates Transport Costs Originated $$ Terminated
Typical Voice Channel 64 Kbps 64 Kbps Latin America’s IP Telephony Market Drivers • IP Network Efficiencies Typical VoIP call 10 Kbps (Toll Quality)
Initial Investment Comparison SOLUTION INVESTMENT CAPACITY ADVANTAGES • Quality • Reliability • Proven Technology Traditional Telephony Class 5 Switch US$20 million 20,000 Lines • Efficiency • New Services Potential • Scaleability IP Pop US$ 100,000 400,000 Minutes per Month IP Telephony • Efficiency • New Services Potential • Scaleability 35 Million Minutes per Month IP Full Operation US$3 to 5 million Source: IDC, 2000
REGULATION QOS BANDWIDTH AVAILIBILITY EQUIPMENT INTEROPERABILITY YEAR 2004 Latin America’s IP Telephony Market Inhibitors REGULATION QOS BANDWIDTH AVAILIBILITY EQUIPMENT INTEROPERABILITY YEAR 2000
Latin America’s IP Telephony Market Inhibitors IP Telephony Regulation - 2000 BRAZIL Not regulated Only licensed operators can carry voice. MEXICO Not regulated. Only licensed LD operators can carry voice. CHILE NO RESTRICTIONS. ARGENTINA Currently banned. Only licensed operators can carry voice . Clients cannot use value-added services to transmit voice. Will open in November 2000. VENEZUELA Not regulated. Only CANTV can offer voice services until October 2000. COLOMBIA Only licensed operators can use VoIP.
Voice Over IP Latin America’s IP Telephony Market Inhibitors - Regulation Regulation
Latin America’s IP Telephony Market Inhibitors Quality of Service (QoS) Telephony Delay Levels (milliseconds) Worst 450 Typical Satellite Level 300 ms 450 400 Unacceptable Delay 400 350 350 Acceptable Delay Typical IP Level 200-350 ms 300 300 250 250 200 200 150 Barely Noticeable Delay 150 Typical PSTN 50-150 ms 100 100 50 No Noticeable Delay 50 0 0 ms Best ms Source: IDC’s IP Telephony Services in Europe, 1998-2003
Latin America’s IP Telephony Market Players • Regional ITSPs: • Wholesale Operators: ITXC, iBasis, GRIC, etc. • Retail Operators: Net2Phone, Deltathree, etc. • Clearing Houses: (AT&T, Telia, etc.) • Local ITSPs: • Incumbents: buying wholesale minutes, offering IP Telephony, installing IP Telephony networks • Clecs: Globus, Cybercenter, etc. • Other Players: ISPs, clandestine operators, callback operators (using IP Telephony), etc.
1999 Traffic (Billions of Minutes) 701 156.5 150.1 75 319 Total ITXC IBASIS DELTA THREE Net2Phone (AT&T) Main Global IP Telephony Players, 1999 • Traffic is growing at an average of 147% per quarter • 13% of traffic is going to and from the LA region • Wholesale (44%) Vs Retail (56%) • New companies playing in the LA space: Ursus, AIC, talk.com,Netvoice, Dialpad, etc. Source: IDC’s IP Telephony Services: Market Review and Forecast, 1998-2004.
PC-to-PC PC-to-phone Phone-to-PC Voice- Enablement Click-to-X Telephony Web Messaging Audio, Video, Document/ File Sharing Web Conferencing Fax-to-email Vmail-to-email Instant Messaging Buddy Lists Web Talk Convergence Business Model Web-centric Talk Services Free to users V-Commerce Mobile Networks
Worldwide Web Talk User ForecastA Web User is a Talking User • Key Assumptions: • Simple, easy-to-user, auto-install utility. • Cellfon quality or better is typical. • 1999 is start-up year for many services. • 12-15 services reach 1 million+ users in 1st half 2K. • Hotmail-like growth expected for PC-to-PC services. Millions Source: IDC, 2000
WebTalk Voice Over IP Regulation Latin America’s IP Telephony Market Inhibitors - Regulation
Web Talk in Latin America: The Chilean Example in 2001 Number of Residential Users: 546,328 % of Residential Users Doing Chat: 50% Number of Residential Users Doing Chat: 273,164 Total Minutes of Webtalk: 255,681,429 Internet Users: 1,138,183 % of Residential Users : 48% % of Minutes of Webtalk: 15% Number of Chat Minutes per Week per User: 120 Number of Minutes per Year per User: 6240 Equivalent to 10% of DLD for that year Total Number of Chat Minutes: 1,704,542,861
What is Next? • Clarify Regulation • Operators: • embrace the technology • generate new services • leverage on the efficiencies • Develop QoS, SLAs • Equipment Vendors: • Achieve true interoperability
Questions? Hector Hernandez Senior Analyst, IDC Latin America hhernandez@idc.com