Download
1 / 20
200 likes | 297 Views
Abundance and structure of microorganisms related to methane cycling in five European peatlands: Influence of plant cover and restoration stage (WP1). A. Gattinger et al.

E N D
Abundance and structure of microorganisms related to methane cycling in five European peatlands: Influence of plant cover and restoration stage (WP1) A. Gattinger et al. Technical University of Munich(at the campus of GSF-Research Center for Environment & Health)Chair of Soil Ecology D- 85764 Neuherberg
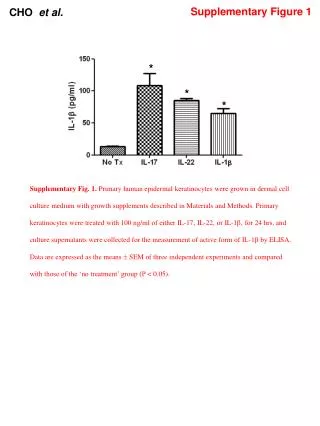
Depth 3 i20:0 4 I20:1 6 8 I40:0 i40:1cyx i40:1cy i40:2cyx i40:2cy Switzerland Switzerland Finland Finland France/L France/L Scotland Scotland France/B France/B I. Depth distribution of archaeal (methanogenic) biomass among countries Pooled for „country“ Country x Depth 100,00 80,00 60,00 PLEL_(nmol/g dm) 40,00 20,00 329 0,00
Depth 2 3 4 6 8 Type I Type II France/B Switzerland Scotland Finland France/L Switzerland Switzerland Finland Finland France/L France/L Scotland Scotland France/B France/B I. Depth distribution of methanotrophic biomass (Type I and II) among countries Pooled for „country“ Country x Depth 15,00 140,00 120,00 15,00 100,00 PLFA (nmol/g dry matter) 80,00 10,00 60,00 40,00 5,00 20,00 0,00 0,00 Country x Depth Country
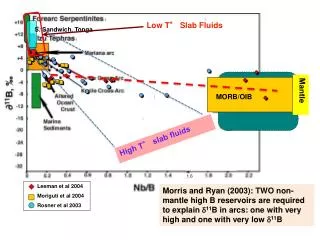
II. Methanogens to methanotrophs along gradients Jura sites Finnland
…the presented data should be combined with CH4/CO2 flux data for making system-related studies.…………………………………………………………………………………..PLFA analyses completed (WP1)apart from specific biomarkers, data of other PLFA is avavailable (saturated, mono-unsaturated and polyunsaturated fatty acids) for calculating total biomasses of eg. Bacteria, fungi, etc.
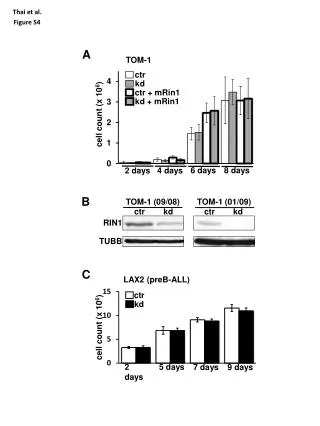
Labelled litter 13C - 15N Peat column towards microbes Microbial communities : 13C PLFA analysis 13C & 15N in microbial biomass towards peat 15N mineralization 13C & 15N (K2SO4 extract without fumigation) WP3: Microbial transformations of plant litter (TUM-BO, ECOBIO, EPFL/WSL)
Labelled litter 13C - 15N Peat column towards microbes Microbial communities : 13C PLFA analysis 13C & 15N in microbial biomass towards peat 15N mineralization 13C & 15N (K2SO4 extract without fumigation) What do we want to know? • Carbon transformation • How much plant C is consumed by the microbial biomass? • How much plant C is used by Bacteria, Archaea, Eukarya and when? • How much plant C is „somehow“ stabilised? 2. N transformation • How much plant N is consumed by the microbial biomass? • How much plant N is mineralised? • How much plant N is somehow stabilised?
Simultaneous identification and quantification of PLFA/PLEL from environmental samples and their corresponding 12C/13C ratios by GC/MS-c-IRMS 20% of the analyte AgilentMSD MS(DSQ) IRMS(DeltaPlusAdvantage) 80% of the analyte
SATFAs (Bacteria) PUFAs (Eukarya)
0 2 1 Bacteria: Gram-positive (i15:0) Horizon 60 50 40 30 20 δ 13C (‰) 10 0 -10 -20 81 41 -30 184 1 2 3 1 2 3 1 2 3 sampling date (= 15d, 60d, 150d) Control Sphagnum Eriophorum
0 2 1 Bacteria: Gram-positive (a15:0) 145 Horizon 60 50 40 30 20 δ 13C (‰) 10 0 179 -10 -20 20 186 -30 1 2 3 1 2 3 1 2 3 sampling date Control Sphagnum Eriophorum
0 2 1 Bacteria: Gram-negative (cy17:0) Horizon 60 50 40 30 20 δ 13C (‰) 10 0 -10 -20 23 175 56 -30 106 83 184 21 -40 1 2 3 1 2 3 1 2 3 sampling date Control Sphagnum Eriophorum
0 2 1 Bacteria: Gram-negative (cy19:0) Horizon 60 50 40 30 20 δ 13C (‰) 10 0 -10 -20 -30 184 107 -40 1 2 3 1 2 3 1 2 3 sampling date Control Sphagnum Eriophorum
0 2 1 Archaea: Euryarchaeota (i20:0) Horizon 80 70 60 50 40 30 δ 13C (‰) 20 10 0 101 -10 108 -20 186 -30 -40 1 2 3 1 2 3 1 2 3 sampling date Control Sphagnum Eriophorum
0 2 1 Eukarya: Fungi (18:2d9,12) Horizon 70 60 50 41 40 30 20 δ 13C (‰) 10 0 -10 -20 35 -30 -40 1 2 3 1 2 3 1 2 3 sampling date Control Sphagnum Eriophorum
0 2 1 Eukarya: Protozoa (20:4d5,8,11,14) Horizon 40 30 20 10 δ 13C (‰) 0 -10 -20 47 161 -30 33 9 142 12 -40 1 2 3 1 2 3 1 2 3 sampling date Control Sphagnum Eriophorum
What needs to be done? • Carbon transformations • LC/IRMS of prepared microbial biomass C (CFE) extracts • Calculation of group-specific microbial plant C utilisation • Mass balance for the „whole“ system 2. Nitrogen transformations • EA-IRMS of prepared microbial biomass N (CFE) extracts • EA-IRMS of mineral N extracts (?) • Calculation of microbial plant N utilisation • Mass balance for the whole system
Standard Chromatogramm
δ13C [‰ PDB] Reproduzierbarkeit des LC/IRMS-Signals • Neue Methode ist: • reproduzierbar stabil • sensitiv • effizient (ca. 100 Proben/Tag) n = 3 + SE