Download
1 / 22
220 likes | 376 Views
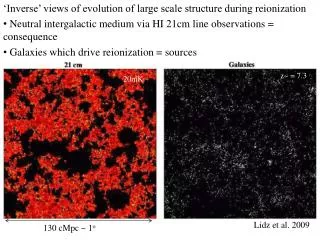
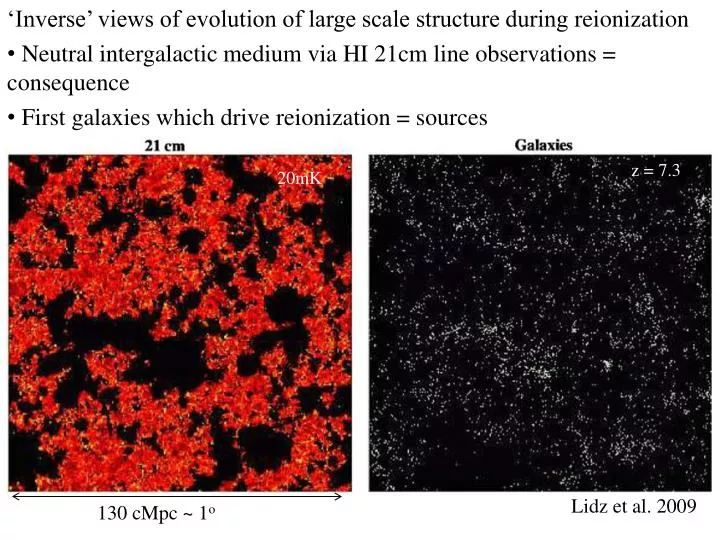
‘Inverse’ views of evolution of large scale structure during reionization Neutral intergalactic medium via HI 21cm line observations = consequence First galaxies which drive reionization = sources. z = 7.3. 20mK. Lidz et al. 2009. 130 cMpc ~ 1 o.

E N D
‘Inverse’ views of evolution of large scale structure during reionization • Neutral intergalactic medium via HI 21cm line observations = consequence • First galaxies which drive reionization = sources z = 7.3 20mK Lidz et al. 2009 130 cMpc ~ 1o
Inverse Views of the Universe: Neutral IGM vs. galaxies • Power • Complete view of physics: sources of reionization and their impact on the IGM • Cross correlation of HI 21cm signal with galaxy distribution mitigates large (but independent) systematic errors (eg. foregrounds) in each measurement (Lidz ea) • Challenge: Currently detecting individual galaxies into reionization in near-IR through radio, but impossible match very (very) large scale of HI measurements with galaxy surveys • HI 21cm experiments cover 100 to 1000 deg2 and z range ~ 6 to 11 • z>6 galaxy surveys by JWST/ALMA have FoV ~ arcmin, dz < 0.5 • Solution: Intensity mapping of the aggregate CO (or [CII] or Lya) emission from the galaxies that reionize the Universe
Large scale galaxy surveys • Classical method: one galaxy at time, eg. SDSS 2e7 galaxies • Intensity mapping: low spatial and spectral resolution imaging of summed signal from aggregates of thousands of galaxies on Mpc scales (tens of arcmin). Classic galaxy surveys (eg. SDSS) Intensity mapping
GBT IM of LSS in HI at z~ 1 Chang ea Optical-21cm cross correlation • Drift scan survey 670 to 930MHz • 15’ res, 1000 km/s/ch • Cross correlation with DEEP2 galaxy survey => Detection! = aggregate HI signal from galaxies on Mpc scales. • First detection of HI 21cm emission at substantial redshift => confirms DLA HI mass density • Promise of mapping large scale structure at high redshift, such as the Baryon Acoustic Oscillations 930MHz 670MHz Freq z=0.53 z=1.12
Emission lines from star forming galaxies 1900GHz 230GHz • CO: dominant tracer of molecular gas in galaxies • [CII]: brightest line, and PDR, CNM, WMN tracer • Low order CO (10 to 40GHz)=> relatively bright, easily observable + wide fields
Mean CO sky brightness temperature in 3 simple steps • 1. Cosmic star formation rate density required to reionize the IGM using mean baryon density (Haardt & Madau, Bunker et al.) • fescuv = ionizing photon escape fraction ~ 0.06 (MW), up to 0.2 for z~3 LBGs • C = IGM clumping factor (recombinations) = 5 to 30 (simulations) • Strong increase with z due to increase in mean cosmic baryon density • 2. Conversion of star formation rate to IR luminosity based on known properties of galaxies (eg. Kennicutt 1998 and many others)
Predicted Mean CO Brightness Temperature 3. Conversion of IR luminosity to CO luminosity based on known properties of galaxies (‘K-S law’; Daddi et al. 2010) • Roughly linear relationship between L’CO and LFIR for disk galaxies at low and high z • Similar slope for merger driven starbursts, with different normalization • Disks likely dominate cosmic star formation rate density
<TB>CO from the galaxies that reionize the IGM at a given redshift • Not what we expect to see at all redshifts, but what is required to have reionization occur at that redshift. • Increases with z due to increasing baryon density Carilli 2011 (1+z)3 <TBsky>z=8 = 1.1 (0.1/fesc)-1 (C/5) uK
Other predictions Signal in range ~ 0.1 to 1 uK at z ~ 6 to 8 108 Mo 1011 Mo Gong ea: Obreschkow & Rawlings CO galaxy catalog based on Millennium simulations Lidz: Sheth-Tormen mass function
Major uncertainties: • fesc – calibrated with JWST observations of 1st galaxies • C – get handle via HI 21m observations (21cm forest absorption?) • Line confusion (30GHz = CO 2-1 z=6.7 or 1-0 at z=2.8): requires dual frequency, cross correlation experiment (eg. 15 and 30GHz). Cross correlation with 21cm will also help. • Early production of CO and dust (SFR – FIR – L’CO relationships?)
Early production of dust + CO: detections of 8 quasar host galaxies at z~6 M(dust) ~ 108Mo, M(H2) ~ 1010 Mo z=6.42 0.15” TB ~ 25K CO3-2 VLA PdBI -150 km/s 7kpc 1” ~ 5.5kpc + +150 km/s SFR – FIR – L’CO relationships can be calibrated with ALMA/EVLA/JWST observations of representative z>6 galaxy samples.
Experimental parameters Radiometry equation COIM: Experimental parameters to match HI 21cm surveys • z = 6 to 10 => 10 to 16GHz CO1-0; 21 to 33 GHz for CO2-1 • BW > 1GHz [dz ~ 0.6 at z ~ 8 for 1-0] • Spectral resolution ~ 100MHz ~ 2000 km/s • Sensitivity = 0.1 to 1 uK per ‘pixel’ • Angular resolution ~ 5’ (~ 15 cMpc at z=8) • FoV > 25 deg2 (LOFAR)
Design I: Keck Institute Study Large single dish with many element focal plane array • Challenge: • Many feeds in focal plane • Spectral baseline stability
Design II: interferometer with many co-mounted, small elements UCB (Bower & de Boer) Challenge: large correlator (6 x EVLA correlator per platform)
Gong ea 2011 Lidz ea 2011 Should easily detect power spectrum in CO
Cross-power CO–HI (10xMWA for HI) 7’ • Next generation HI instrument needed • Cutoff set by angular resolution of low freq array
References Righi ea 2009, A&A, 489, 489 Gong et al. 2011, ApJ, 748, L46 Carilli 2011 ApJ, 730, L30 Lidz et al. 2011 ApJ, 742, 70 Visbal & Loeb 2011, JCAP 8, 10
Sources responsible for reionization Galaxies at z>7 >1um <1um HST/WFC3 Bouwens et al. 2010 ~ 100 candidates detected to date? Note: quasars (SMBH) are insufficient to cause reionization
Reionization by normal galaxies Roberston + Ellis 2010 • For fescuv> 0.2 (typical of z~3 LBG • reionization at z ~ 7 requires C < 30 • reionization at z ~ 8 requires C < 10