Download
1 / 38
380 likes | 550 Views
Aging in Place. Judith L. Warren, Ph.D. Professor and Gerontology Specialist Texas Cooperative Extension Texas A&M University System September 2003. Demographics of Aging in America. Increasing numbers of older adults Migration to sunbelt Out-migration of youth in rural areas

E N D
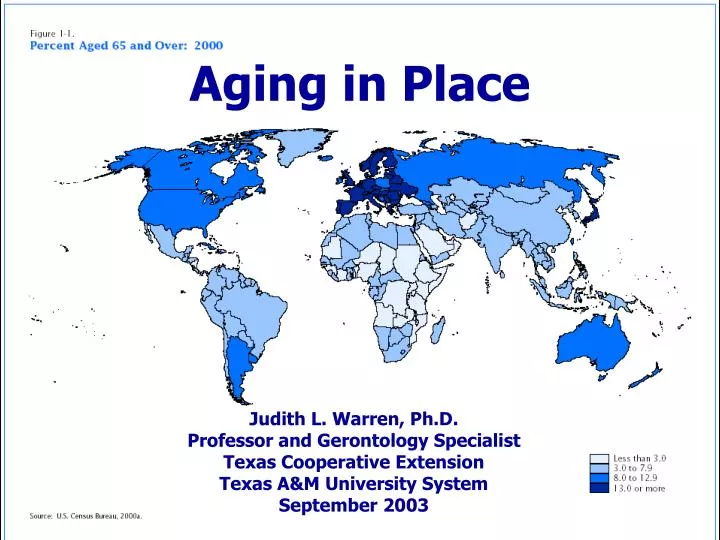
Aging in Place Judith L. Warren, Ph.D. Professor and Gerontology Specialist Texas Cooperative Extension Texas A&M University System September 2003
Demographics of Aging in America • Increasing numbers of older adults • Migration to sunbelt • Out-migration of youth in rural areas • Aging in place • Gender and income • Increasing Hispanic population • Household configuration • Education • Health and healthcare access
Core Issues in an Aging Rural Society • Economic Development/Human Capital • Work and Volunteer Issues • Careers in an Aging Society • Independent Living • Housing and Services • Chronic Health Conditions • Elder Care • Formal and Informal • Family Caregiving
Percent of Population by Age Group: 2003 – 2050 Source: U.S. Census Population Projections
Greatest Growth in Old-Old 85+ Age group increased 38% between 1990/2000 95+ Age group increased 34.7% Centenarians (100+) • 1990 - 37,306 • 2000 – 50,454 • Greatest # live in New York and California • Greatest % live in South Dakota and Iowa
Baby Boomers are allin the same state “the state of denial”
Age 65+ Males per 100 Females • Ratio declines with each age group • Increase in male to female ratio since 1990 • Are men getting healthier? • Are women at increased health risk?
Sources of Income & Net Worth • Main source continues to be Social Security and Pensions • Between 1984 and 1999, the median net worth for 65+ head of households increased by 69%; for 45-64 – it declined by 23% • 1999 Median for White - $181,000; for African Americans - $13,000
Labor Force Participation • Decline in participation rates • Most decline occurred prior to 1980 • Today, 8-10 boomers expect to work part or full time • Under $30,000 income -1/5th of boomers are at risk
Household Type & Expenditure • In 2000, 25.8% householders lived alone; 9.2% of these householders were over 65. • 21% of all household units were over 65 years of age: 10.9% 65-74; 7.8% 75-84; and 85+ 2.3%. • Housing burden varies by income with the bottom 1/5th of the median household income spending 36% and the top 1/5th spending 26% of their income on housing.
Arthritis Diabetes Hypertension Chronic Sinusitis Vision Osteoporosis Hearing Varicose Veins Heart Disease Deformity/Other Emphysema Dementia 34% are affected by more than 1 condition Chronic Health Issues of Older Adults
Chronic Diseases, Complications and Disability Will Increase • Today, obesity affects 20-30% of 4th graders; 50% of 9th & 10th graders • 2010: 50% of 20-30 year olds will have diabetes • 2020: 50% of 30-40 year olds will have complications and disability • 2020: 50% loss in workforce; 50% depend on Medicare/Medicaid/disability income
Walking 35% Getting outside 45% Bathing 30% Transferring 22% Dressing 17% Using toilet 14% Eating 4% Preparing Meals 28% Managing $$ 26% Using the phone 21% Light housework 31% FunctionalLimitations in 85+
Percentage of Total Out-of-pocket Expenditures Allocated to Health Care in Households Headed by Persons 65+ Income Level Source: Consumer Expenditure Survey, Non-Institutionalized Elderly, Chartbook 2000, U. S. Census
Caregiver Profile • Est. 45-52 million individual caregivers • 10-25% of population provides care • Women represent 74% of primary caregivers • Spouses provide 36% of care; daughters 29% and sons, 8% • Average caregiver 63 years old • 69% live with care recipient
Grandparent Caregiving • 11% of grandparents care for grandchildren for at least 6 months • At least 55% of children in relative care live with a grandparent • 77% are female grandparents • 62% are non-Hispanic white • Factors increasing chance for raising grandchildren: poverty level; being African-American; and divorce, drug abuse or incarceration of child’s mother
More Secure Steady employment Married, dual income Employer pension 401(k) plan Health insurance Home equity Long-term investments Less Secure Intermittent employment Divorced or single No pension No 401K No health insurance Rent No long-term investments or savings for emergencies The Two America’s of Retirement Security
Core Issues in an Aging Rural Society • Economic Development/Human Capital • Work and Volunteer Issues • Careers in an Aging Society • Independent Living • Housing and Services • Chronic Health Conditions • Elder Care • Formal and Informal • Family Caregiving
Economic Development & Human Capital • Rural mainstays: schools, nursing homes, hospitals, small businesses • Long-term care jobs at poverty or near-poverty level; 92% turnover in Nurse Aides; Frontline caregivers increasingly non-English speaking • Aging workforce: • 22% eligible to retire in 2005 • Greater proportion of health care professionals are 55+ than other occupations • Increased need for geriatric training
Work & Financial Security • Leading economic indicator of family hardship not unemployment but no health insurance • 2/3 of working poor have no health insurance • Personal savings remain low compared to other developed countries
Independent Living • Housing • Services
1997 Title III Service Use • Lower usage rates in rural vs. urban areas • Rural, non-Hispanic Black elders participate at disproportionately higher rates than other 60+ users • Non-white Hispanic elders participate at disproportionately lower rates than other 60+ users
Independent Living • Prevent Chronic Disease • Managing Chronic Disease
Elder Care • Formal and Informal Care • Family Care
Summary • We are an Aging Society-undeniably • Economic disparity between population segments continues to grow affecting health and quality of life outcomes • Disparity between rural and urban areas continues with high percentages of elders in rural areas and a declining economic base • Rural areas have opportunities to focus on health and care solutions • Public policies are needed which reward disease prevention and foster smaller scale eldercare solutions


![[READ DOWNLOAD] Aging in the Right Place](https://cdn7.slideserve.com/12653594/slide1-dt.jpg)