Download
1 / 24
240 likes | 248 Views
This text describes the observations and analysis of bore events that occurred on June 4th at Homestead. It includes details of the surface cooling, dynamic cooling, amplitude-ordered waves, cold front passage, and wave propagation.

E N D
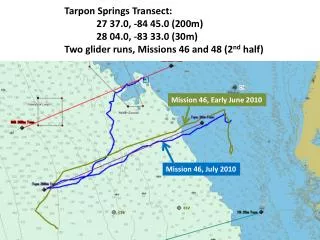
First eventHomestead observations onlyleading wave @ Homestead at 6:45 Z
Note limited surface cooling, for the first bore event. Dynamic cooling is superimposed on radiative cooling, sunset is at 2:00 Z, sunrise at 11:30 Z The real dynamic cooling occurs 2 hours after the second bore event. Radiative cooling 7 Z AERI sounding “first” bore another bore?? “second” bore
First event FM-CW 6-8 Z Three amplitude-ordered waves, the first one the tallest - this suggests a mature bore system. However there is one low-amplitude wave ahead, also seen by MAPR
this suggests some vertical mixing Cold front?? First a 2 mb pressure jump associated with bore, then some waves 2nd event 1st event ISS1 location: at Homestead
Amplitude-ordered wave train - but first wave seems smallest?? Anyway, this image is consistent with FM CW
second eventleading wave @ Homestead at 10:50 ZUWKA/WCR data cold front “second” bore
DDC wsr-88d 17:04Z This may or may not be the same event. ~90 km in 3h45m implies a speed of 6.7 m/s
1500 m AGL 1000 11:00 12:00 FM-CW 10-13 Z Cold-frontal passage around 12:50 Z Is this real?? 10:50: first UWKA leg over Homestead
10:50: strong, gusty winds were reported by a person on the ground at Homestead 10:50: first UWKA leg over Homestead
10 Z 11 Z considerable cooling 700-910 mb AERI soundings inversion suggests calm conditions 12 Z parent density current?? 13 Z
June 4 2002 Height below flight level (m) Time (UTC) Flight level: 1850 m AGL Homestead WCR nadir antenna reflectivity Aspect ratio: 1:4 dBZ the ground FLIGHT LEVEL DATA ON THE NEXT PAGE Homestead Some wave activity ?? WCR echo strength is very weak at night, compared to the daytime CBL …
SE NW potential temperature temperature Wave propagation • BORE: • The sustained nature of the change, ahead of a much more shallow gravity current, suggests that this is a bore. • This flt level (1850 m AGL) seems to penetrate the bore: the flt level temp behind the bore is some 3 K less. • This suggests that the waves are deeper than what FM-CW suggests • Consistent with AERI, the air is more humid behind the bore, with some 4 g/kg more water vapor. However the cooling may NOT be consistent with AERI. • The net effect is a higherqe behind the bore, about 5 K higher. • WAVETRAIN: • The covariance of q and T imply that the aircraft didn’t bob up & down in a stratified, undisturbed environment, but rather that the aircraft was rather level in a wavetrain • The waves are ranked in amplitude, the first one the highest amplitude, and they may be ranked in wavelength, the first one the shortest; this is consistent with FM-CW & MAPR • The vertical drafts have a magnitude of ~2 m/s or less. • Assume that this is simultaneous transect. The coldest air has seen a history of ascent, so the wave must move forwards. • The pressure variations at this level are mainly a response of the aircraft to the vertical motion field in which it is embedded, flying from right to left. A 1 m/s updraft during 20 sec is 20 m ascent or 2 mb hydrostatic pressure decrease. vertical air velocity static pressure c w (u,v) Homestead theta-e mixing ratio
NW SE Flight level ~250 m Wave crest ahead of cold front?? Homestead Where is the trailing wavetrain? It may be further to the SE - unfortunately this is the end of this flight leg
SE NW Flight level ~160 m frontal motion Prefrontal updraft/cooling wave trofs on the cold-frontal surface? Cold front Cold front reaches Homestead ~12:50, ie 60 min later over 30 km, ie the frontal speed is ~ 8 m/s Cold front Homestead
VHF radio interference WCR up-looking SE NW Height above flight level (m) Time (UTC) WCR nadir antenna reflectivity Flight level: 160 m AGL WC zenith antenna reflectivity Aspect ratio: 1:4 dBZ Prefrontal updraft/cooling Cold front wave trofs on the cold-frontal surface?
NW SE June 4 2002 Height below flight level (m) Time (UTC) WCR nadir antenna reflectivity Flight level: 750 m AGL Aspect ratio: 1:4 dBZ The wave crests were associated with shallow lenticular clouds, and cloud droplets may explain some of the echo. It is not clear what the continuous fine line is. cold front below (<750 m deep) Homestead
NW SE Conclusion for the 11:57-12:10 leg: I suspect that this is a gravity wavetrain above the cold frontal surface. The highest amplitude wave appears to be just ahead of the sfc cold front, separated by some 15 km. Perhaps this is the beginning of a new bore? Flight level: 750 m wave propagation another low-amplitude wave ? Homestead