Download
1 / 24
240 likes | 383 Views
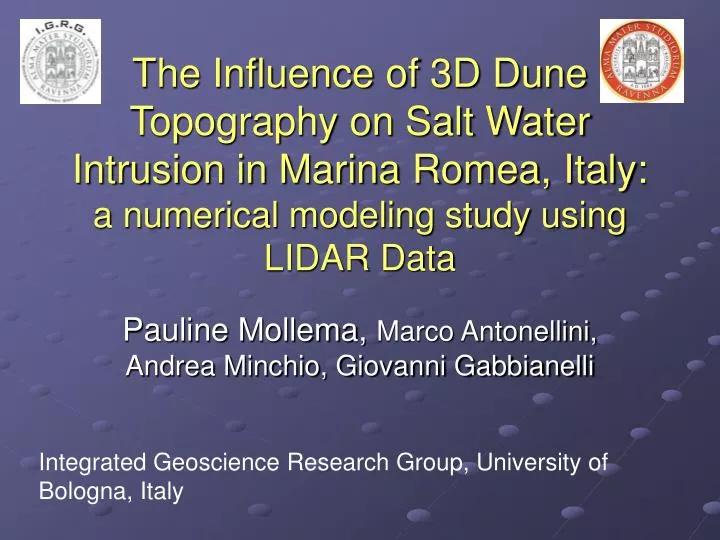
The Influence of 3D Dune Topography on Salt Water Intrusion in Marina Romea, Italy: a numerical modeling study using LIDAR Data. Pauline Mollema, Marco Antonellini, Andrea Minchio, Giovanni Gabbianelli. Integrated Geoscience Research Group, University of Bologna, Italy. River Po. Study area.

E N D
The Influence of 3D Dune Topography on Salt Water Intrusion in Marina Romea, Italy: a numerical modeling study using LIDAR Data Pauline Mollema, Marco Antonellini, Andrea Minchio, Giovanni Gabbianelli Integrated Geoscience Research Group, University of Bologna, Italy
River Po Study area Italy Study AreaMarina Romea, Province of Ravenna, Italy N Scolo Rivalone Swamp (fresh) Lamone River Marina Romea Fiume Lamone Pialasse Swamp (salt) Harbor Pine Forest Marina di Ravenna Pialassa Pontazzo Strada statale 309 Romea N Agriculture 2 km Mollema SWIM 2008
Study area 2 Drain Pine Forest Beach, dunes and bathing establishments River Lamone Mollema SWIM 2008
Factors that may enhance salt water intrusion in unconfined aquifer Marina Romea • Dune destruction • Land drainage • Subsidence • Presence of salt water in river on north and swamp on west • Beach erosion • Evapotranspiration Pine Forest • Connate water Mollema SWIM 2008
Monitoring of salinity and water table RiverLamone Pine Forest Dunes 17g/l PZMR3A PZMRPC PZMR4B PZMR3B 18g/l 100 m PZMR2B Drain River Lamone Mollema SWIM 2008
30 20 10 0 Monthly Monitoring of Salinity in Piezometers Dunes 2007-2008 Salinity [g/l] PZMR2B Feb 08 March 07 Pine Forest 2007-2008 30 20 PZMRPC PZMR3B Salinity [g/l] PZMR3A 10 PZMR4B 0 Mollema SWIM 2008 March 07 Feb 08
Light Detection and Ranging (LIDAR) SUBSIDENCE Ravenna’s historical center subsided 70 cm between 1953-1995 The coastal zone more than 1 m Due to water and gas extraction RESULT No accurate topographic maps THEREFORE We used LIDAR data to construct a topographic map Mollema SWIM 2008
LIDAR DATA in Triangulated Irregular Network (TIN) format River Lamone Pine Forest Adriatic sea Mollema SWIM 2008
Sampling of LIDAR data in GRID of 10 *10 m Mollema SWIM 2008
Original Lidar data versus Gridded data River Lamone Pine Forest TIN of 10 by 10 m grid Original LIDAR data Mollema SWIM 2008
Model • SEAWAT (USGS) • Visual Modflow Interface (SWS Schlumberger Water Services) • 10 layers, 54 columns 36 rows • Simulation period 60 years – 100 years Mollema SWIM 2008
Grid, Boundary Conditions and Geology Constant Head Boundary 0.2 m Pine Forest Recharge 15 mm/yr Dunes Recharge 200 mm/yr Drain Conductance 10m/day 360 m Adriatic Sea General Head Boundary Kx=ky=Kz=0.00069 m/s Sand Kx=Ky=5.8E-6m/s Kz=1/3 KxSand Clay Silt Kz=1/3 Kx=Ky=3.5E-9 m/s Clay 540 m Mollema SWIM 2008
Model without drain, simulation time 60 years Sea West Dunes 3m <1 g/l 20 m 35g/l 540 m Mollema SWIM 2008
Drain Sea West Dunes 0.3 g/l 3m T=60 anni 20 m 35g/l 540 m Model with drain simulation time 60 years Mollema SWIM 2008
Drain Dunes N N Sea Map of water table contours Layer 1 model with drain after 60 years. Layer 1, sand 0.2m 0.14 m 0.12 m 0.1m Mollema SWIM 2008
Drain Dunes N N Sea Map of water table contours Layer 4 model with drain after 60 years. 0.1m 0.2m 0.1m . 0.0m Layer 4, sand clay silt Mollema SWIM 2008
Drain Dunes N Sea Map of salt concentration contours Layers 1 and 4 model with drain. LAYER 1 sand LAYER 4 Sand clay silt LAYER 4 Mollema SWIM 2008
Model with drain simulation time 100 years Sea Drain 20g/l 20g/l 10g/l 30g/l West 0.3 g/l 3m T=60 anni 20 m 35g/l 540 m Mollema SWIM 2008
Model with Drain and high dispersivity (10 m) and high vertical conductivity Sea Drain West 3g/l T= 60 years HIgher salt concentrations under dunes, but not in rest of aquifer. 540 m Mollema SWIM 2008
Model with thin sand formation at top, high dispersion (10m) and Kz=Kx Sea E W V Kx=Ky=Kz=6.9E-4m/s Kx=Ky=Kz=5.8-5m/s Kx=Ky=Kz=1.2E-6m/s 540 m Mollema SWIM 2008
drain 0.05m 0.05m 10g/l 20g/l 0.0m Model with thin sand formation at top, high dispersion (10m) and Kz=Kx Sea E W Mollema SWIM 2008
N Layer 1 sand Head [m] Map of head contours Layer 1 Model with drain, thin sand layer at top Drain Dunes TOPOGRAPHY 0.04 0.08 0.05 0.08m 0.06 0.03 0.02 0.07 0.07m Sea 0.02 0.07m Mollema SWIM 2008 540 m
Drain Dunes N Sea Map of salt concentration contours Layer 1 model with drain, thin sand layer at top Layer 1 sand 15g/l 10g/l 10g/l 10g/l 10g/l 25g/l Mollema SWIM 2008
Conclusions • Lidar data is useful to create topographic maps • Effect of dune topography on salt water intrusion in Marina Romea is small, visible only in uppermost low conductivity layers, not in sand above. • Dune destruction cannot be sole cause of salinization of unconfined aquifer: topography and recharge are large enough to maintain a layer of fresh water. • Dune topography has a larger influence on water table and salt distribution if dispersivity is high, if interface sand-silt is close to surface and if Kz is high. • Our model is insensitive to initial salt concentration • The salt concentrations are still responding to changes (dune destruction) started 60 years ago. Mollema SWIM 2008