Download
1 / 24
240 likes | 337 Views
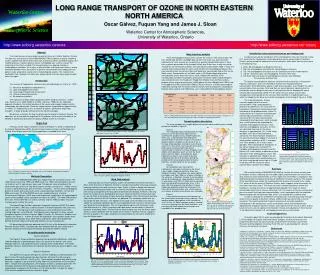
Evolving Understanding of Pollutant Transport from Asia to North America. Richard (Tony) VanCuren Research Division, California Air Resources Board Department of Applied Science, UCD WRAP 5-23-06. TransPacific Transport to North America: The contradiction of gas and aerosol data. MOPITT CO

E N D
Evolving UnderstandingofPollutant TransportfromAsiatoNorth America Richard (Tony) VanCuren Research Division, California Air Resources Board Department of Applied Science, UCD WRAP 5-23-06
TransPacific Transport to North America:The contradiction of gas and aerosol data MOPITT CO 2000 TOMS Aerosol April15-May6 1998
The April 1998 Asian Dust Storms: a Natural Experiment Image after Husar, R. B. et al., J. Geophys. Res. 106: 18,317 –18,330, 2000.
Asian Dust is UbiquitousAround the Northeastern Pacific VanCuren & Cahill, 2002
Asian Aerosol Chemistry at Western Cordillera Sampling Sites • Two Asian components: • Primary - Dust & combustion • Mass correlation 0.87 (<2.5um) • Secondary - Aged biomass smoke • Mass correlation 0.17 (<2.5um) • Mean Asian aerosol fraction: • 75% of Fines (<2.5 mm dia.) • 60% of Total (<10 mm dia.) • Principal Components from: • 1234 IMPROVE 24-hr filters • March - October 1988-1999 • Crater Lake, OR and Mt. Lassen, CA VanCuren, 2003
Dusty Asian Plume Siberian(?) Biomass Smoke Aerosol Composition March – October(Transport Season)Crater Lake / Mt. Lassen • Mean Asian fraction: • 75% of Fines (<2.5 mm) • 60% of Total (<10 mm) COARSE 2.9 ± 1.9 mg/m3 FINE 3.8 ± 2.0 mg/m3 OTHER CARBONACEOUS SO4= SOIL NO3-
Marine mode Medium to coarse sea salt (2-6 mg/m3) Weak sulfur (.2-.4 mg/m3) Continental mode Coarse Si, Fe, Ca, Al, Na, K Strong fine sulfur (1-2 mg/m3) Mineral & reacted Na Weak sea salt (.2-.6 mg/m3) MARINE 5/19 CONTINENTAL 4/22 Trinidad Head Aerosol Composition Modes
Trinidad Head, Trinity Alps, & Mauna Loa Continental Aerosols’Al - Elemental Ratios(Holmes & Zoller, 1996) Trinidad Head Trinity Alps
ITCT-2K2 Findings: 1 - Dominant Modes Concordant Montane AerosolSingle dominant aerosol Asian origin confirmed by soil element profiles Concentration varies but continuously presentMBL Disconnects Coastal Site from Free TroposphereSea salt & local combustion – infrequent tropospheric mixing
ITCT-2K2 Findings: 2 - Air Mass Mixing State Soil Mixing Model Air Mass Influence
ITCT-2K2 Findings: 3 - Soil Mixing State Diurnal oscillation of sources Coarse - strong local sources and upslope transport Fine - dominated by tropospheric fumigation
Asian Sources Explain “Anomalous” Regional Aerosol Events 2/24/1996
Regional Aerosol Chemistry:Feb 21 & 24, 1996 2/21/96 2/24/96
Back-trajectories - 2/24/96 Craters of the Moon Bryce Canyon Grand Canyon
Sample Global Model Results • Cameron-Smith, P. et al., (2005), Impact of Long-Range Dust Transport on Northern California in Spring 2002, Internal Report Lawrence Livermore Lab • Holzer, M., T. M. Hall, and R. B. Stull (2005), Seasonality and weather-driven variability of transpacific transport, J. Geophys. Res., 110, D23103, doi:10.1029/2005JD006261. • Park, R. J. et al. (2004), Natural and transboundary pollution influences on sulfate-nitrate-ammonium aerosols in the United States: Implications for policy, J. Geophys. Res., 109, D15204, doi:10.1029/2003JD004473. • Heald et al. Transpacific transport of Asian anthropogenic aerosols and its impact on surface air quality in the United States, Submitted to J. Geophys. Res.
Cameron-Smith, P. et al., (2005), Impact of Long-Range Dust Transport on Northern California in Spring 2002, Internal Report Lawrence Livermore Lab
Holzer, M., T. M. Hall, and R. B. Stull (2005), Seasonality and weather-driven variability of transpacific transport, J. Geophys. Res., 110, D23103, doi:10.1029/2005JD006261.
Holzer, M., T. M. Hall, and R. B. Stull (2005), Seasonality and weather-driven variability of transpacific transport, J. Geophys. Res., 110, D23103, doi:10.1029/2005JD006261.
Park, R. J., D. J. Jacob, B. D. Field, R. M. Yantosca, and M. Chin (2004), Natural and transboundary pollution influences on sulfate-nitrate-ammonium aerosols in the United States: Implications for policy, J. Geophys. Res., 109, D15204, doi:10.1029/2003JD004473. “Bulk aerosol measurements from the DC-8 aircraft indicate that 40% of non-sea-salt sulfate (nss-SO4=) on average was incorporated in dust particles [Jordan et al., 2003]…. “The observation shows strong outflow in the 0- to 5-km column. The model also shows an enhancement in that column but is lower than observations by up to a factor of 2.
Heald et al. Transpacific transport of Asian anthropogenic aerosols and its impact on surface air quality in the United States, Submitted to J. Geophys. Res.
Concluding Thoughts • The coast ranges and Sierra-Cascade generally prevent Pacific marine boundary layer air from reaching the continental interior of North America. • TransPacific Transport is strongest in spring, but occurs year-round. • The free troposphere “background” aerosol contains “natural” desert dust, anthropogenic dust, and combustion products from Asia: ¼ soil; ¼ SO4=; 2/5 carbonaceous aerosol. • North-westerly winds associated with “clean air corridors” commonly carry Asian aerosols, thus the “clean 20%” in the West is significantly influenced by global pollution levels. • At “clean” western IMPROVE sites, as much as 3/4 of PM2.5 and 2/3 of Coarse Particles may come from Asia. • Emissions growth and control efforts in Asia may modify visibility in North America.