Download
1 / 21
210 likes | 341 Views
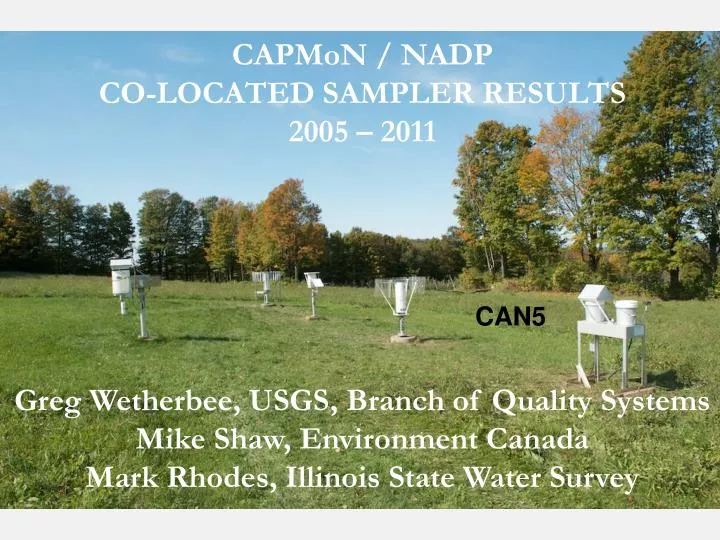
CAPMoN / NADP CO-LOCATED SAMPLER RESULTS 2005 – 2011 Greg Wetherbee , USGS, Branch of Quality Systems Mike Shaw, Environment Canada Mark Rhodes, Illinois State Water Survey. CAN5. PA15. CAPMoN MIC / MICB. NADP ACMs. AIRMoN and NTN Aerochem Metrics 301. CAPMoN MIC. grid sensor

E N D
CAPMoN / NADP CO-LOCATED SAMPLER RESULTS 2005 – 2011 Greg Wetherbee, USGS, Branch of Quality Systems Mike Shaw, Environment Canada Mark Rhodes, Illinois State Water Survey CAN5
PA15 CAPMoN MIC / MICB NADP ACMs
AIRMoN and NTN Aerochem Metrics 301 CAPMoN MIC
grid sensor AIRMoN and NTN grid sensor CAPMoN
LOWESS Lines 75th percentile Median 25th percentile CAPMON-NADP PRECIPITATION DEPTH DIFFERENCE, IN mm Median Difference: 0.8 mm 2005-2011
CAPMON-NADP PRECIPITATION SAMPLE DIFFERENCE, IN mm LOWESS Lines 75th percentile Median 25th percentile Median Difference: 1.9 mm 2005-2011
Statistically Significant Bias @ a=0.1 Per Sign Test
Statistically Significant Bias @ a=0.1 Per Sign Test
Statistically Significant Bias @ a=0.1 Per Sign Test
Median Difference: 0.009 mg/L LOWESS Lines 75th percentile Median 25th percentile
LOWESS Lines 75th percentile Median 25th percentile CAPMON-NADP [SULFATE] DIFFERENCE, IN mg/L 2005-2011 Median Difference: 0.055 mg/L
LOWESS Lines 75th percentile Median 25th percentile CAPMON-NADP [NITRATE] DIFFERENCE, IN mg/L Median Difference: 0.104 mg/L 2005-2011
LOWESS Lines 75th percentile Median 25th percentile CAPMON-NADP [CALCIUM] DIFFERENCE, IN mg/L Median Difference: 0.011 mg/L 2005-2011
LOWESS Lines 75th percentile Median 25th percentile CAPMON-NADP [MAGNESIUM] DIFFERENCE, IN mg/L Median Difference: 0.003 mg/L 2005-2011
LOWESS Lines 75th percentile Median 25th percentile Median Difference: 0.053 mg/L CAPMON-NADP [AMMONIUM] DIFFERENCE, IN mg/L 2005-2011
LOWESS Lines 75th percentile Median 25th percentile Median Difference: 0.011 mg/L CAPMON-NADP [CHLORIDE] DIFFERENCE, IN mg/L 2005-2011
LOWESS Lines 75th percentile Median 25th percentile CAPMON-NADP [SODIUM] DIFFERENCE, IN mg/L Median Difference: 0.002 mg/L 2005-2011
LOWESS Lines 75th percentile Median 25th percentile Median Difference: 0.003 mg/L CAPMON-NADP [POTASSIUM] DIFFERENCE, IN mg/L 2005-2011
CONCLUSIONS • Consistent and comparable results for the CAPMoN and NADP • Merging data from the two network for continental scale studies is appropriate. • Biases quantified for CAPMoN versus NADP measurements were consistent between the 2005-2011 and 1996-2004 periods.
CONCLUSIONS • CAPMoNvalues are commonly higher than NADP values. Precipitation sensors, Sample containers, Sampling frequency, and Sample-processing protocols. • Over the 2005-2011 period, the variability in differences remained consistent for calcium, magnesium, sodium, potassium, ammonium, hydrogen-ion, sample depth and precipitation depth. • Variability decreased for chloride, nitrate, and sulfate differences after 2008.