Download
1 / 28
280 likes | 501 Views
Project Planning Using MS Project. URBS 609 Project, Unit 1. Introduction and Background. About This Training Module.

E N D
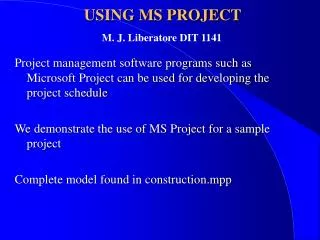
Project Planning Using MS Project URBS 609 Project, Unit 1 Introduction and Background
About This Training Module This training module was crafted using PowerPoint by Microsoft Corporation. It has been packaged with PowerPoint Viewer, a standalone Microsoft product that allows a user to view this module without use of PowerPoint. • Left mouse-click or enter to go to next slide • Right mouse-click or backspace to go to previous slide • ESC to exit this module This Unit of Instruction was crafted by Robert Hugg For Minnesota State University, Mankato Urban and Regional Studies Institute - 2004 Urban and Regional Studies Institute
Training Module Preview • This module will provide: • Introduction to the background of MS Project • Introduction to the Advantages of using MS Project • Introduction to the Hazards of using MS Project • Tips for using MS Project • Background material for project planning • This module is constructed as the first of three blocks in a building block approach Urban and Regional Studies Institute
MS Project Assumptions • The first assumption of any project planning is that the project goal and tasks are defined • MS Project uses the same assumptions as planning a project manually: • All tasks have distinct begin and end points • All estimates can be mathematically derived • Tasks must be able to be arranged in a defined sequence that produces a pre-defined result • Like any tool, MS Project cannot define the goal of a project, the user must do that Urban and Regional Studies Institute
The Basis of MS Project • MS Project is a strong tool that is built around the PERT and CPM basics • (See PERT/CPM blocks of instruction to review the basics if these terms are unfamiliar) • Based on same basic PERT calculations invented in 1958 • Based on same basic CPM calculations invented in 1958 • Incorporates use of a WBS (Task list) format invented in the 1960s Urban and Regional Studies Institute
The Basis of MS Project • A highly visual, yet checklist-intensive program • Balances visual approach (charts, graphs, etc) with logical structured approach (task and resources lists) • The most widely used PM program because: • It is fairly generic in its approach • Highly automated once configured; requires relatively low amount of user manipulation • Scalable – can be used for small to enormous projects • A cost-effective choice for casual users • Easy to use core techniques • Advanced techniques are complex, however Urban and Regional Studies Institute
MS Project Strengths • Good step-by-step tutorial for beginners • Good searchable keyword help function • Based on data entry – once configured, user enters data and Project automatically: • Computes all times and costs • Optimistic, Pessimistic, Likely and PERT- expected • Identifies Critical Path, computes late & early start dates, slack • Computes % complete on a task and project level • Identifies areas of over-tasking of resources • Draws a wide ranges of charts and graphs specific to the project • Creates a wide range of reports specific to the project • VERY customizable to meet individual user needs Urban and Regional Studies Institute
MS Project Strengths Sample MS Project Charts and Diagrams • Based on configuration and data entered by the user, MS Project plots Gantt Charts Urban and Regional Studies Institute
MS Project Strengths Sample MS Project Charts and Diagrams • Based on configuration and data entered by the user, MS Project plots Task Calendars Urban and Regional Studies Institute
MS Project Strengths Sample MS Project Charts and Diagrams • Based on configuration and data entered by • the user, MS Project plots Network Diagrams Urban and Regional Studies Institute
MS Project Strengths Sample MS Project Charts and Diagrams • Based on configuration and data entered by • the user, MS Project plots Resource Graphs Urban and Regional Studies Institute
MS Project Strengths Sample MS Project Tables and Reports • Based on configuration and data entered by • the user, MS Project plots Tabular Data Urban and Regional Studies Institute
MS Project Strengths Sample MS Project Tables and Reports • Based on configuration and data entered by • the user, MS Project plots Tabular Tracking Data Urban and Regional Studies Institute
MS Project Strengths Sample MS Project Tables and Reports • Based on configuration and data entered by • the user, MS Project plots High Level Reports… Urban and Regional Studies Institute
MS Project Strengths Sample MS Project Tables and Reports • …to-do lists on a person by person basis… Urban and Regional Studies Institute
MS Project Strengths Sample MS Project Tables and Reports • …lists of tasks that should have started but have not… Urban and Regional Studies Institute
MS Project Strengths Sample MS Project Tables and Reports • …lists of tasks that are scheduled to begin soon… Urban and Regional Studies Institute
MS Project Strengths Sample MS Project Tables and Reports • …lists of critical tasks (makes it easy to identify tasks that become critical once a project is crashed)… Urban and Regional Studies Institute
MS Project Strengths Sample MS Project Tables and Reports • and much, much more • All charts, diagrams, and reports are designed to help a manager organize and track a project • All come in a standard configuration • Most typically used information • Easiest to read format • All are also customizable to show the most meaningful data Urban and Regional Studies Institute
MS Project Strengths • Flexible and customizable • Designed to enhance communication • Between manager and workers • Between managers and stakeholder • A good tool to manage expectations • Charts, diagrams, tables etc can be saved in various formats for use: • On the web, in print, electronically Urban and Regional Studies Institute
MS Project Weaknesses • Makes it easy to lose touch with the project – very automated • Automates all calculations • Scheduled dates, costs projected dates, etc • Tracks when a resource is over-allocated but does not provide a warning when it happens • Conflicts are not intuitively displayed • Will “let” a project get over budget/over-time • A tool that must be monitored when used Urban and Regional Studies Institute
MS Project Weaknesses • No Risk Assessment Function • Does not calculate probability of completion • A Key weakness – this info is always requested • A Manager must compute this manually/with Excel • Crashing costs/times are not calculated • Must be computed on a task basis and then compared to the baseline (or done manually) • Assumes manual intervention by Project Manager • Crash the project manually and save as a new baseline • Project is heavily influenced by the Earned Value method (EVM)– typical Risk Assessment is not a factor in EVM Urban and Regional Studies Institute
MS Project Benefits Review • Much less work for a user compared to manual/MS Excel project planning • Does most of the required calculations • Wide range of graphs, charts, reports • Very customizable, very flexible • Makes communicating project status easier – expectation management Urban and Regional Studies Institute
MS Project Hazards Review • Very Automated – easy to lose touch • No Risk Assessment function • Must be done in MS Excel/manually • Based on PERT/CPM but also influenced by EVM • Weighs by project/task costs, not just completion • Does not consider intangible progress that is common in Social Sciences projects • Knowledge as part of the process, not just the result • Progress as part of the process not just task completion Urban and Regional Studies Institute
Tips for Using MS Project • Know the project goal before beginning • Know the required tasks before beginning • Identify resources before beginning • Identify task relationships before beginning • Refer to the tutorial as often as needed • Refer to help section as often as needed • Keep the configuration as simple as possible • Avoid losing touch with the project Urban and Regional Studies Institute
MS Project Final Thoughts • MS Project is only a tool –it does not create or “own” the project – it reflects the data provided • The simpler the configuration, the easier the data will be to understand, for all involved • If the plan doesn’t look right, it probably isn’t • Check resource and task assignments/relationships • Check constraints and dependencies • Look for what has changed in a plan and follow the clues - a small unintentional change can wreak havoc Urban and Regional Studies Institute
Dr. Anthony Filipovitch MS Project, by Microsoft Corporation MS Excel, by Microsoft Corporation PM Body of Knowledge (PMBOK), Philadelphia: PMI, 2000 Project Management Institute (PMI) Resource Center Project Management Institute Website Resources Used in This Unit Urban and Regional Studies Institute
You have completed URBS 609 Project Unit 1 Please proceed to URBS 609 Project Unit 2 This Unit of Instruction was crafted by Robert Hugg For Minnesota State University, Mankato Urban and Regional Studies Institute - 2004 Urban and Regional Studies Institute