Download
1 / 23
230 likes | 317 Views
Seasonal Prediction Research and Development at the Australian Bureau of Meteorology. Guomin Wang With contributions from Harry Hendon, Oscar Alves, Eun-Pa Lim and Claire Spillman Centre for Australian Weather and Climate Research: A partnership between the Bureau of Meteorology and CSIRO.

E N D
Seasonal Prediction Research and Development at the Australian Bureau of Meteorology Guomin Wang With contributions from Harry Hendon, Oscar Alves, Eun-Pa Lim and Claire Spillman Centre for Australian Weather and Climate Research:A partnership between the Bureau of Meteorology and CSIRO
Outline • POAMA (Predictive Ocean Atmosphere Model for Australia) • Australian Rainfall Prediction • Leeuwin Current Prediction
POAMA Overview • The Bureau Dynamical Seasonal Prediction System POAMA • First version went operational in 2002 • A new version (POAMA1.5) became operational recently and a newer version is in development • POAMA development evolves as part of Australian Earth System Modelling project ACCESS • WebpagePOAMA.BOM.GOV.AU
POAMA Model Components Atmospheric Model BAM T47L17 -> T63L17 -> ACCESS(UKMO+LSM) 3h OASIS Coupler time Heat flux, P-E Ocean Model ACOM2 lat/lon/lev=0.5~1.5/2/25 -> AusCOM
Hindcasts Design • Control run initialized at 00Z on the first day of each month, 1980-2006 • Extra 9 members initialized prior to control run initial time in progressively 6 hours interval • Each hindcast is integrated for 9 months (lead 1-9)
Skill Assessment: ACC for SST and Heat Content SST H300 +1 +3 +5
Skill Assessment: ACC for SST Pacific & Indian Ocean Indices Nino3.4 IOD ACC RMS
El Nino Vintage and Impact on Australian Rainfall 1997 2002 Correlation between Australian drought index and SST Wang and Hendon (2007)
Classic El Nino Nino 3 Index – SSTA over the Nino3 region (210E-270E, 5S-5N) El Nino Modoki EMI = [SSTA]Central – (0.5[SSTA]East + 0.5[SSTA]West) El Nino: Classic vs Modoki (from Weng et al. 2007)
R ~ 0.86 at LT1 • Classic El Nino events: 82, 87, 97 R ~ 0.83 at LT1 • El Nino Modoki events (EMI >= 0.7 STD): 86, 90, 91, 93, 94, 02, 04
SST Forecast Composites Classic El Nino El Nino Modoki OBS (SON) POAMA LT 1 (1st Sep Start) POAMA LT 3 (1st Jun Start)
Australian Rainfall Forecast Composites Classic El Nino El Nino Modoki OBS (SON) POAMA LT 1 POAMA LT 3
Cases 1997 vs 2002 1997 2002
Seasonal Prediction of the Leeuwin Current: Observed Features Freemantle sea level (FSL) is indicative of volume transport variation of the leeuwin current (M. Feng). Use FSL as a proxy for Leeuwin Current strength.
Annual Mean of SST & top 300m Currents from Reanalyses POAMA SST and UV300 clim 1982-2003 GODAS SST and UV300 clim 1982-2003 ECOR SST and UV300 clim 1982-2003 Eq 20ºS 40ºS 90ºE 120ºE 90ºE 120ºE 90ºE 120ºE POAMA GOGAS/NCEP ODA/ECMWF
Fremantle Sea Level and Ocean Heat ContentObservation vs Forecast Skill Obs relationship between H300 and SLA at Freo HCNW = 15-25ºS,112-120ºE H300 ACC Skill at leadtime=7
Fremantle Sea Level and SSTObservation vs Forecast Skill N34 = 5ºS-5ºN; 170º-120ºW
Skill of Fremantle SLA Prediction from Downscaling Scheme Nino4 NWHC Both Combined Persist
FSLA Forecasts 1982-2006 FSLA Obs FSLA Lead 3 FSLA Lead 6 FSLA Lead 9 82 83 84 85 86 87 88 89 90 91 92 93 94 95 96 97 98 99 00 01 02 03 04 05 06 Years
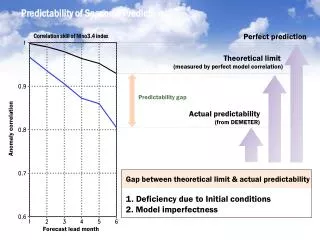
Summary • Introduction of The Australian Bureau’s Dynamical Seasonal Prediction System POAMA. • POAMA has higher skill for SST in Pacific and for heat content along NW Australia. • POAMA can predict short term El Nino vintage and respective Australian rainfall responses. • Using POAMA forecasts a downscaling scheme shows useful seasonal forecast skill for Leeuwin Current strength.
Summary • Each El Nino event has different flavour • The impact of the central Pacific warming El Nino (represented by El Nino Modoki Index) is as important as the traditional eastern Pacific warming El Nino for Australian rainfall • POAMA has good skill to predict: - the occurrence and the detailed SST structure of the central Pacific El Nino and the traditional El Nino events - the Australian rainfall difference affected by these two types of El Nino events - 97 and 02 El Nino events and associated Australian rainfall the skill stems from the improved atmospheric initial conditions by ALI and the model’s atmosphere-ocean coupling ability.