Download
1 / 27
280 likes | 442 Views
GROUND MOTION INTENSITY MEASURES THAT CORRELATE TO ENGINEERING DEMAND PARAMETERS Jonathan Bray and Thaleia Travasarou University of California, Berkeley PEER IM Working Group:

E N D
GROUND MOTION INTENSITY MEASURES THAT CORRELATE TO ENGINEERING DEMAND PARAMETERS Jonathan Bray and Thaleia Travasarou University of California, Berkeley PEER IM Working Group: Abrahamson, Bray, Conte, Cornell, Deierlein, Kramer, Krawinkler, Porter, Silva, Somerville, Stewart, Stojadinovic Pacific Earthquake Engineering Research Center
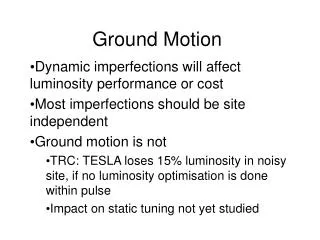
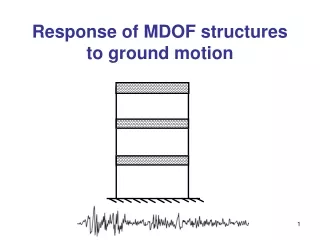
SHAKING-INDUCED DAMAGE to Bridges and Buildings Moehle
Seismic Displacement LIQUEFACTION-INDUCED DAMAGE EERC Slide Collection EERC Slide Collection
PRIMARY PEER EARTHQUAKE ENGINEERING ISSUES • Building or Short Bridge, including site response and SSI • Long-Span Bridge, including site response and SSI • Networks with Multiple Structures • Liquefaction and Lateral Spreading • Seismic Slope Instability and Permanent Ground Deformations
BUILDING OR SHORT BRIDGE, INCLUDING SITE RESPONSE AND SSI • Engineering Damage Parameters (EDP): • Story Drift, Base Shear, Input Energy, and Floor Acceleration • Drift, Max. Curvature, Column Curvature or Displacement Ductility • Intensity Measures (IM): • Sa(T1), PGV, PGD, SPGA, Sa(T1)[Sa(2T1)/Sa(T1)]0.5 • Other combinations by Cornell involving Sa(T1) and Sa(T2) • Vectors by Conte or Krawinkler • Tpulse,D 5-95, Ia
LONG-SPAN BRIDGE, INCLUDING SITE RESPONSE AND SSI • Engineering Damage Parameters (EDP): • Drift, Max. Curvature, Column Curvature or Displacement Ductility • Intensity Measures (IM): • Sa(T1), PGV, PGD • Vector by Hutchinson et al. • D 5-95, CAV, Ia
NETWORKS WITH MULTIPLE STRUCTURES • Engineering Damage Parameters (EDP): • The IM (e.g. PGA) • Intensity Measures (IM): • PGA • Sa(T1) • PGV • Ia
LIQUEFACTION AND LATERAL SPREADING • Engineering Damage Parameters (EDP): • Factor of Safety Against Liquefaction (FSl) • Pore Pressure Ratio (ru) • Intensity Measures (IM): • Cyclic Stress Ratio (CSR) or PGA • CAV5 • Ia • Equivalent Number of Uniform Stress Cycles or D 5-95 • Combination or Vector
SEISMIC SLOPE INSTABILITY AND PERMANENT GROUND DEFORMATIONS • Engineering Damage Parameters (EDP): • Permanent Ground Displacement (U) • Intensity Measures (IM): • Ia • Sa(T1) • PGV or EPGV • Response Spectrum Intensity (SI) • Characteristic Intensity (Ic) • Combination or Vector
Notes on the Intensity Measure Breakout Session - PEER Annual Meeting - Jan. 17, 2002 ·Testbeds will not provide definitive answers as to the best single IM for all future use. · The preferred way to compare IMs is to use “stripes”. (i.e., for each IM, scale records to the same IM level, do nonlinear runs, and compare their dispersions, with secondary recognition of possible difficulties with respect to “sufficiency”). The most efficient solution is to use the same runs on records scaled to the same first-mode Sa to test all IMs. However, it is not yet clear that such runs can be effectively used to study other IMs. · Another solution is to provide the same records in their original unscaled condition, and then apply the “cloud” method (i.e., a regression of response on IM) to estimate the dispersion. This is equally applicable to all IMs, but it will take one additional set of runs for all records. ·For each record, it should contain the list of IM values and the list of EPD outputs. Standard IM values (e.g., Sa, Ia) can probably be provided by an individual; other more exotic IM values should be provided by the proponent. ·The lists of preferred IMs and EDPs to be studied for each testbed need to be compiled. ·A standardized procedure for evaluating efficiency and sufficiency of IMs needs to be agreed to and documented for others to use.
PEER IM-EDP Meeting of April 26, 2002 • Overall Objective: • Identify ground motion Intensity Measures that “best” correlate to meaningful Engineering Demand Parameters • develop a refined list of promising IMs • standardize the manner in which IMs will be evaluated • resolve some of the difficult issues identified at January's meeting.
PRIMARY PEER EARTHQUAKE ENGINEERING ISSUES • Original • Building or Short Bridge, including site response and SSI • Long-Span Bridge, including site response/SSI • Networks with Multiple Structures • Liquefaction and Lateral Spreading • Seismic Slope Instability and Permanent Ground Deformations • Revised • Short-period systems, Ia • Long-period systems, SI • Specific Systems, Sa(T1) or more sophisticated IMs
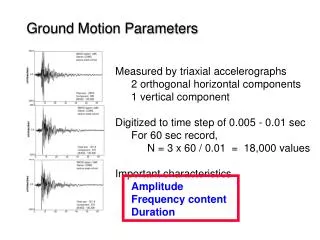
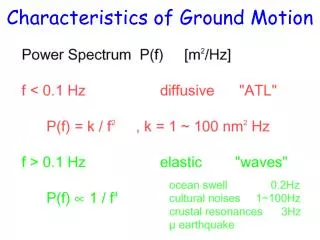
PERIOD-INDEPENDENT INTENSITY MEASURES Peak Ground Acceleration PGA Peak Ground Displacement PGD Arias Intensity (Arias, 1970) Cumulative Absolute Velocity (Kramer 2002; 5 cm/sec2 threshold) Response Spectrum Intensity (Housner, 1959) Peak Ground Velocity PGV & Pulse Period Tv
PERIOD-DEPENDENT INTENSITY MEASURES Spectral Acceleration at Fundamental Period Spectral Combination (Cordova et al. 2000) Spectral Vector (Conte, 2002) Spectral Combination IM1I&2E (Luco and Cornell, 2001) Sa(T1) Sa(T1)
Summary of Discussion of April 26, 2002 Meeting: Participants discussed specific findings from their studies on the ability of various IMs to estimate important EDPs for their particular problems, which included from bridge response, nonlinear building response, liquefaction and seismically induced permanent slope displacements. Allin Cornell discussed procedures for studying alternative candidate IMs, and his current recommendations are located at www.peertestbeds.net/Crosscutting.htm Here, efficiency and sufficiency are discussed. Both the “stripes” method and the direct regression “cloud” method were found to be acceptable ways of moving forward. Efficiency was determined to be more tractable and more important than sufficiency. An IM with twice the dispersion requires 4x as many runs to obtain an equivalent sense of the true median response. Joel Conte’s work was especially helpful for understanding how a vector of IMs may be developed (see www.peertestbeds.net/Crosscutting.htm) Most found that the spectral acceleration at the fundamental period of the system being analyzed worked well and is the default IM for most problems. Some promising combinations of spectral acceleration and some vectors containing spectral acceleration for normal cases and PGV for near-fault cases were also identified. Several researchers noted the advantage of using a non-system specific IM for studies that involved many systems of various characteristics (several sites that might liquefy or experience permanent displacement and network studies of many systems). For problems involving the response of short period systems, Arias Intensity was found to be promising, and a new attenuation relationship for this ground motion parameter was distributed at the meeting.
EFFICIENCY Seismic Displacement: Ts = 0.3 s, ky = 0.05
EFFICIENCY Seismic Displacement: Ts = 1.0 s, ky = 0.05
SUFFICIENCY ln(D) = a + b ln(Ia) + c ln(Ia)2 + d M+e ln(R) Ts = 0.3s ky = 0.05
Longitudinal drift ratio Longitudinal drift ratio (Mackie and Stojadinovic, 2002)
IM Attenuation Relationship Data Set Standard Deviation Ia (m/s) Travasarou et al. (2002) 1208 records from 76 world wide shallow crustal events up to 1999. (4.7 M 7.6) 0.82 PGA (g) Abrahamson & Silva (1997) 655 records from 58 world wide shallow crustal events up to 1994. (4.5 M 7.4) 0.43 SA(T=.5s) (g) Abrahamson & Silva (1997) 655 records from 58 world wide shallow crustal events up to 1994. (4.5 M 7.4) 0.54 Tp (s) Rathje et al. (1998) 306 records from 20 earthquakes in active plate-margin regions. (5.7 M 7.3) 0.56 Tm (s) Rathje et al. (1998) 306 records from 20 earthquakes in active plate-margin regions. (5.7 M 7.3) 0.35 D5_95 (s) Abrahamson & Silva (1996) 655 records from 58 world wide shallow crustal events up to 1994. (4.5 M 7.4) 0.49 Standard deviation of the random error for different intensity measures for a M=7.5 strike-slip earthquake at R = 10 km on soil.
Rel. PGA Sa Ia D5-95 U Atten 0.50 0.58 0.90 0.49 2.3 DM/IM 1.09 0.96 0.84 2.23 -
Cornell (2002) “Guidance for Evaluating Alternative IMs • Stripes Analysis: each record within a hazard bin must be scaled to the same IM value for that hazard level, say Sa(T=1s) and PGAmed; • compare the dispersion of the EDP vs. each IM within a hazard bin (median should be similar); a dispersion reduction of ~30% implies that half the number of nonlinear dynamic analyses are required. • Need a new set of runs for each candidate IM • Regression (Direct/Cloud) Method: use unscaled records; perform regression of EDP vs. candidate IM, and estimate standard deviation of the residuals of the fitted model; compare standard deviations of each candidate IM; but it is a measure of both the variability of the EDP vs. IM and the regression model used. • Need only one set of runs • Modified Stripes Analysis: use stripes method to evaluate primary IM, say Sa(T=1s) and then evaluate scatter of other IMs given that records have been scaled to Sa(T=1s); implies dependency; Cornell et al. are currently investigating this approach. • Need only one set of runs
A Vector of Ground Motion Intensity Measures (Conte et al. 2002) £ £ 0 . 3 Scale Factor 3.0 84-percentile Sa level Primary Intensity Measure: Sa(T0, x) • Ground Motions scaled to three levels of Sa : Median Sa, 16-percentile and 84-percentile. • Distortion of earthquake records minimized by restricting the scale factors to reasonable values, namely Sa [g] Median Sa level 16-percentile Sa level Secondary Intensity Measures: T0 [sec] • ProposedIntensity Measures • Maximum Value of 1 • Measures of damage effectiveness of a given ground motion record • Obtained using Bilinear Inelastic SDOF system with a = 0
Testbed Ground Motions Somerville and Collins (2002) Uniform Hazard Spectra developed for outcropping soft rock for 50% in 50 yrs, 10% in 50 yrs, and 2% in 50 yrs level. Using available recorded ground motion records that represent the controlling event’s M and R at each hazard level, 10 to 20 ground motions were selected. For Humbolt Bay Bridge, M = 7 to 8 and R = 5 to 20 km for Sa(T=1.23s) All motions provided unscaled and scaled so that each record has Sa at T=1.23s equal to that of uniform hazard spectra at each hazard level. For I-880 Bridge, M = 6.6 to 7 and R = 7 km for Sa(T=1s) All motions provided only unscaled until representative period is selected. User must transform FN and FP components into logitudinal and transverse components. Motion sets inherently contain some forward-directivity and fling motions.
ENGINEERING DEMAND PARAMETERS BRIDGES Drift Ratio, Peak Column Curvature, Displacement Ductility, Curvature Ductility Mackie and Stojadinovic (2002) PEER Report: 1.) global response - drift ratio 2.) intermediate response - maximum column moment 3.) local response - material stress BUILDINGS Ductility Demand, Residual Ductility Demand Peak Story Drift, Peak Story Drift Angle Normalized Hysteretic Energy Dissipated LIQUEFACTION Pore Pressure Ratio Factor of Safety Against Liquefaction SEISMIC SLOPE STABILITY Seismically-Induced Permanent Displacements
SUMMARY OF PRIMARY INTENSITY MEASURES • PGA • PGD • PGV & Pulse Period • Ia • CAV5 • SI • Sa(T1) • Spectral Combination • Spectral Vector * Bold IMs have attenuation relations available