Download
1 / 20
210 likes | 368 Views
The 3rd International Workshop on Next Generation Climate Models for Advanced High Performance Computing Facilities Tokyo, Japan, March 28 -30, 2001 Performance and Verification of the Oil Spill Modeling System for the Sea of Japan. Sergey M. VARLAMOV

E N D
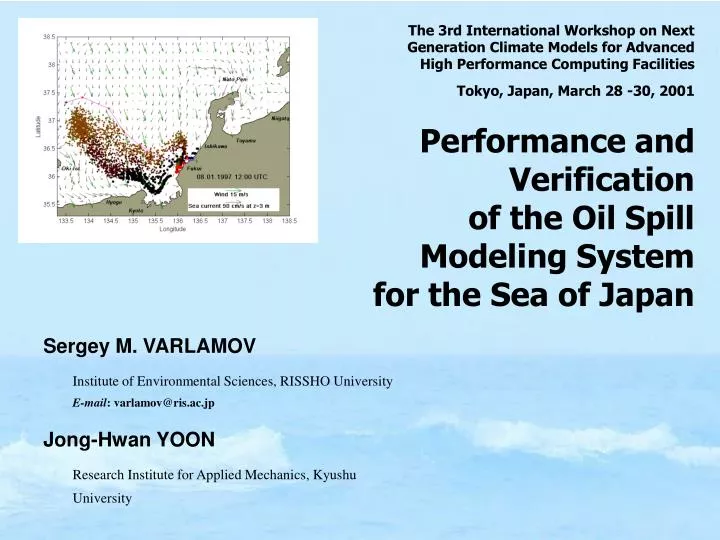
The 3rd International Workshop on Next Generation Climate Models for Advanced High Performance Computing Facilities Tokyo, Japan, March 28 -30, 2001 Performance and Verification of the Oil Spill Modeling Systemfor the Sea of Japan Sergey M. VARLAMOV Institute of Environmental Sciences, RISSHO UniversityE-mail: varlamov@ris.ac.jp Jong-Hwan YOON Research Institute for Applied Mechanics, Kyushu University
Motivations: • The risk of environmental disasters related with the spilling of oil products into the sea forces the development of the high-quality oil spill simulation and prediction system. It would be an important tool for the planning of the spill protection and spill response operations etc. • Simulation of the oil spreading and fate in the sea is one of practical applications that requires and integrates the results of meteorological, oceanographical and the “oil spill” modeling communities...
Most important questions: • Where will go the oil after it was spilled in to the sea? - from the start of incident up to it removing from the sea due to any processes • What will be the oil state at all stages of spill? - density (buoyancy) - viscosity (recovery techniques) - emulsion state (amount to recover) - [chemical composition - toxicity] etc.
Fate of oil spilled at sea Spreading Horizontal and vertical transport by wind and sea currents Natural dispersion Buoyancy Emulsification Evaporation Dissolution Photo-oxidation Sedimentation and shoreline stranding Biochemical degradation
Oil spill simulations system(Varlamov et. al., 2000) JMA Meteorological subsystem Meteorological data Oil spill model * Spill Transport and Weathering Particles Tracking Model Ocean Circulation Models Ocean currents data Environmental data Graphical analysissubsystem Oil property data Oil spill simulations
Ocean circulation models • At nowadays the ocean circulation models is a part of system Reasons: no products similar to meteorological analysis and forecasts, i.e. 3D currents, temperature, salinity, waves field are available ... • OCM’s spatial resolution and model domain defines the scale and applicability area of the oil spill analysis and prediction system although the simplified version with the local wind drift currents model could be applied for any area covered by meteorological forecasts and with the land-sea mask defined (GTOPO30 for the global version).
Ocean circulation models Oil spill analysis and prediction system was tested with two types of the Japan Sea ocean circulation models: • 3-D primitive equations Modular Ocean Model (GFDL MOM) • 1/6° grid (1218 km horizontal resolution) • 19 vertical levels (step 15 m in upper layers; up to 600 m below 1500 m) • rigid grid approximation • wind drift shear local current model + 2-D shallow water nonlinear model (2.5 dimensional model) • bi-linear vertical turbulent eddy viscosity profile (Poon & Madsen, 1991) • variable vertical step (from 1 m in upper sea layer) • 1/12° grid (69 km horizontal resolution) • 16 tidal constituents are used at the open boundaries etc.
Outline of Oil Spill Fate and Trajectory Model (year 2001 version) -1 Particles tracking model: Spill is presented as an ensemble of particles each characterized by its properties that includes - position on plane and the depth - diameter - density - viscosity - fraction of water in oil (emulsion) - fraction evaporated - fraction [biochemically] degradated etc.
Outline of Oil Spill Fate and Trajectory Model (year 2001 version) -2 Depending on position, model oil particles are - transported by wind (at the sea surface) - transported by 3D sea currents - experience buoyancy effect - 3D random diffusion (wind and current dependant) - oil–coastal line interaction - evaporation at the sea surface (Fingas, 1996) - emulsification at the sea surface (Mackay et al, 1980) - biochemical degradation - [oil-sea bottom interaction]
Outline of Oil Spill Fate and Trajectory Model (year 2001 version) -3 Other model properties: - universal 2D horizontal bicubic spline interpolation from arbitrary meteorological, bottom topography, and ocean circulation model grids (with masking of land surface meteorological data) - initial droplet diameters distribution in accordance with observed dispersion droplet size distribution (Delvigne and Sweeney, 1988), modified by weathering processes, both “permanent” surface slick and oil dispersed into the water column are simulated - modification of oil particles density and viscosity as result of emulsification, evaporation and biochemical degradation - assimilation of observed oil slick position for long-term spill simulation
Technical Characteristics and the Improvement of System Performance Model properties: - programming languages: C (system routines and meteorological GRIB data decoding software) and FORTRAN-90 (ocean circulation and spill models) - OpenMP directives are used for the parallelization of ocean circulation and spill physical core modules - computational effects on the parameterization of physical processes was analyzed and fixed (buoyancy-vertical diffusion-particles diameter-integration time step problem)
Routine oil spill simulation and prediction system parameters • Meteorological analysis and forecasts data are received once a day. Total 3.7 Mb are received, and at 18:00 UTC (local night) it usually takes approximately 7 - 8 minutes • SW OCM is started and run the currents simulation and prediction for 126 h (5 days). With 10s time step it takes 1 h 03 min on 667 MHz Alpha processor (GFDL MOM 1/12° - 25 min) • Oil spill simulation could be run by operator and for 5 days with 10000 droplets it will takeless then 14 min
System Verification: Simulation of the Osung No 3 Oil Spill in the Sea of Japan Fragment of the Ocean Circulation Model Domain in Tsushima strait area (TerrainBase topography) Korea Pusan Tsushima Isl. Japan Hakata
Volume Transport - Camelia Line Monitoring results (Data of Takikawa & Yoon, 2000) Total Western Channel Eastern Channel Runing average total volume transport through Tsushima strait at the Hakata-Pusan section (‘Camelia’ Line, 03.1997-06.1999 )
Model simulations with smoothed ETOPO5topography(Eastern/Western channel volume transport ~2.2 when ~0.8 expected) Model simulationswith TerrainBasetopography
Tidal Sea Level Variations RMS Error = 12 cm RMS Error = 9 cm Idzuhara (upper) and Hakata (lower) tidal stations, February 2000Observed (blue, black) and simulated(red) sea level anomalies, cm.
Oil spill accident with Korean tanker OsungNo 3 - 229 kl of Bunker C oil spilled- Largest part of oil was recovered (April 8-9)- April 9, 1997 15:45 JST coastline of N.Tsushima Isl. was polluted Animated Simulation Results:Push on the map to start demonstration, esc to stop it, the label fields pass to the next slide.Model particles in upper 2 m layer, size by color.Sea current and surface wind drift (4% of wind speed)
Oil concentration in upper 2 m layerIt is strongly related with the model particles size and trace mainly the surface drifting slick position Animated Simulation Results:Push on the map to start demonstration, esc to stop it, the label fields pass to the next slide.Sea current and surface wind drift (4% of wind speed)
Tanker Osung No 3 oil spill incident simulation Some spill model integral parameters Total number of active modeloil particles Mean (volume weighted) diameterof floating model oil particles, m Relative mass of oil stranded at the shoreline Mean (volume weighted) dynamic viscosity of floating oil, cP
Conclusion • Oil spill numerical simulation system could provide important information for the short term (at least up to 4-5 days) planning of accidental oil spill recovery operations