Download
1 / 41
420 likes | 430 Views
Chapter 6: LabVIEW. Part 1: Introduction. Objectives. What is Data Acquisition and Why use it? Overview of LabVIEW Develop an idea of what LabVIEW really is Learn what graphical programming language and dataflow mean Get a feel for the LabVIEW environment

E N D
Chapter 6: LabVIEW Part 1: Introduction
Objectives What is Data Acquisition and Why use it? Overview of LabVIEW Develop an idea of what LabVIEW really is Learn what graphical programming language and dataflow mean Get a feel for the LabVIEW environment Learning VI programming through example
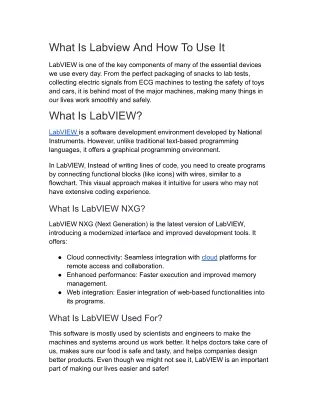
What is Data Acquisition and Why use it? • Traditional Experiments – signals from sensors are sent to analog or digital meters, read by the experimenter, and recorded by hand • In automated data acquisition systems the sensors transmit a voltage or current signal directly to a computer via a data acquisition board. • Software such as LabVIEW controls the acquisition and processing of such data • The benefits of automated systems are many: • Improved accuracy of recording • Increased frequency with which measurements can be taken • Potential to automate pre and post processing and build in quality control
Overview of LabVIEW • LabVIEW – Laboratory Virtual Instrument Engineering Workbench • Graphical programming language that allows for instrument control, data acquisition, and pre/post processing of acquired data
Graphical programming language& Data flow • LabVIEW relies on graphical symbols rather than textual language to describe programming actions • The principle of dataflow, in which functions execute only after receiving the necessary data, governs execution in a straightforward manner.
How does LabVIEW work? • LabVIEW programs are called: Virtual Instruments (VIs) because their appearence and operation imitate actual instruments. • However, they are analogous to main programs, functions and subroutines from popular language like C, Fortran, Pascal, …
In LabVIEW you can create or use “virtual instruments” (VI) for data acquisition. A VI allows your computer screen to act as an actual laboratory instrument with characteristics tailored to your particular needs. You can also use built-in examples, or use standard templates for setting up your data acquisition input channels.
A VI has three main parts: • The front panel: an interactive user interface of a VI, so named because it can simulates the front panel of a physical instrument. • The block (or wiring) diagram: It is the VI’s source code, constructed in LabVIEW’s graphical programming language, G. It is the actual executable program. Subroutine in the blockdiagram of VI. • Icon/connector
Chapter 6: LabVIEW Part 2: The LabVIEW Environment
Objectives Learn how the three main parts of the LabVIEW environment – the front panel, block diagram, and icon/connector – work together. Learn the difference between controls and indicators& Be able to recognize their block diagram terminals. Learn about the capabilities and uses of the toolbar, toolspalette, controlspalette, functionspalette, and subpalettes.
Front Panels Simply put, the front panel is the window through which the user interacts with the program. • When you run a VI, you must have the front panel open so that you can input data to the executing program. • The front panel is where you see your program’s output.
Components of a front panel: The front panel is primarily a combination of controls and indicators.
Control? or Indicator? Controls=Inputsfrom the user = Source Terminals Indicators=Outputsto the user = Destinations
Manipulating Controls and Indicators • Right click on an indicator to • Change to control • Change format or precision • Right click on a control to • Change to indicator • Change mechanical action (whether to latch open or closed, and what to use as default…)
Block Diagrams The block diagram window holds the graphical source code of a LabVIEW VI – it is the actual executable code • You construct the block diagram by wiring together objects that perform specific functions. • The various components of a block diagram are terminals, nodes and wires.
Terminals When you place a control (or indicator) on the FRONT PANEL LabVIEW automatically creates a corresponding control (or indicator) terminalon the BLOCK DIAGRAM
Control or Indicator Terminal? Control terminals have thick borders Indicator terminals have thin borders
? Deleting Block Diagram Terminals Here ! • By default, you cannot delete a block diagram terminalthat belongs to a control (or indicator). • The terminal disappears only when you delete its corresponding control (or indicator) on the FRONT PANEL.
Nodes Nodeis just a fancy word for a program execution element– Nodes are analogous to statements, operators, functions and subroutines in standard programming language: • The addand subtract functions represent one type of node. • A structure is an other type of node. Structures can execute code repeatedly or conditionally, similar to loops and case statements in traditional programming languages. • LabVIEW has also special nodes, called formula nodes, which are useful for evaluating mathematical formulas or expressions.
Wires Wires Node A LabVIEW VI is held together by wiresconnecting nodes and terminals; they deliver data from one source terminal to one or more destination terminals.
Basic wires used in block diagramsand corresponding types Each wire has different style or color, depending on the data type that flows through the wire:
Broken wires If you connect more than one source or no source at all to a wire, LabVIEW DISAGREES with what you’re doing, and the wirewill appearbroken
Components of a block diagram– Review ! – • Nodes: program execution elements • Terminals: Ports through which data passes between the block diagram and the front panel and between nodes of the block diagram • Wires: Data paths between terminals
Dataflow Programming – Goingwith the flow • Stated simply, a node executes only when data arrives at all its input terminals; • the nodes supplies data to all of its output terminals when it finishes executing; • and the data pass immediately from source to destination terminals.
Icons and Connectors The icons and connectors specify the pathways for data to flow into and out of VIs. • The icon is the graphical representation of the VI in the block diagram. & • the connector defines the inputs and outputs more on this later…
Front Panel & Wiring Diagram. • It is often helpful to view both simultaneously using the Windows-Tile Left and Right command from the pull down menu. • A new (empty) VI is shown below with the key pull-down menu pallets visible.
Modifying a VI • Only one of the two windows (front panel or wiring diagram) is active at any point in time. To activate one simply move the mouse over it and click a mouse button. • To display any of the pallets (tools, controls, or functions) you can use the Windows pull down menu or simply left or right click your mouse. • When you first pull up a pallet an image of a push pin is displayed in the upper left hand corner. Click on it to keep the pallet continuously displayed.
Tools palette . . . Select a feature to edit or move Add/edit text Operate a control Probe Data (troubleshoot) Wire features together to control flow of data
Controls palette . . . Insert a boolean control (button or switch) Insert a digital indicator or control
Functions palette . . . Add a numeric operator (+,-,…) Add a structure such as for, while, and case statements Add a boolean operator (and, or…) Timing/dialog Comparison File I/O Signal analysis Data Acquisition Mathematical Functions
Toolbar . . . Font ring Continuousrun Distributionring Run Stop Pause Alignmentring Debugging features more on this later… Reorderobjects
The Run Button • The Run button, which looks like an arrow, starts VI execution when you click on it • It changes appearance when a VI is actually running. • When a VI won’t compile, the run button is broken
Chapter 6: LabVIEW Part 3: Examples
Example 1: Craps • From the functions – numeric panel insert a pair of dice • From the Controls panel insert a numeric digital indicator (on the front panel) • Use the wiring tool to connect the two (in the wiring diagram) and click the “run” button repeatedly. • Numbers from 0.00 to 1.00 should be displayed in the front panel
Example 1: Craps (continued) • Delete the wire • Add a multiplication node and a numeric constant to allow multiplication by 5 • Add an addition node and numeric constant to allow addition of 1 • Add a mathematical “Round to Nearest” node. • Make a second copy of this structure to represent a second die and wire them together through an addition node with an output to a numeric constant This wiring diagram simulates the rolling of 2 dice and their addition to form a number from 2 through 12.
Example 2: Analog & Digital Voltmeter(simulated signal) • Uniform noise used as simulated signal – Functions – Signal Processing – Signal Generation menu • Absolute value function from functions – numeric menu • Mean value of data series from the functions – mathematics – Probability and Statistics menu • The 250 ms wait implemented from the time and dialog menu slows the “flutter” of the meter.
Example 3: Reading an analog input signalRequires A/D board to implement • From the functions menu select data acquisition and then analog input. Then select either “Sample Channel” or Sample Channels” • This places the sampling icon in your wiring diagram • You then need to configure the channel(s) and wire the output to other parts of your program.
Example 5: Creating Sub-VIs • In wiring diagram use selection tool (mouse box) to select all items to be in the SubVI. • From Edit menu select “Create SubVI” • Double click on new icon and save it as a separate VI. • Cut-and-paste it at will or insert it using “Functions – Select VI menu”