Download
1 / 35
360 likes | 517 Views
Displaying Hyperspectral Images on RGB Displays. Victoria Kogan November 2012 This presentation was prepared for a seminar on hyperspectral images, Computer Science Department, University of Haifa, Israel. Agenda. Introduction Comprehensive Representation Algorithms

E N D
Displaying Hyperspectral Images on RGB Displays Victoria Kogan November 2012 This presentation was prepared for a seminar on hyperspectral images, Computer Science Department, University of Haifa, Israel
Agenda Introduction Comprehensive Representation Algorithms 1BT Based Band Selection Principal Components Analysis (PCA) Spectral Weighting Envelopes Misc Data Scaling and Effective Gammut Adapting to Data SNR Projections with Additional Info
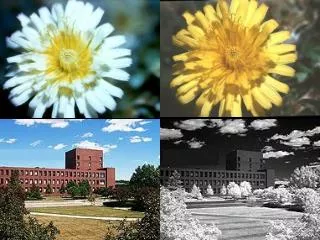
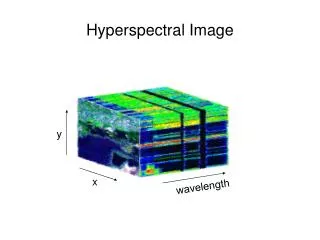
Introduction Hyperspectral and multispectral images may contain hundreds of image bands. Much analysis of hyperspectral imagery is performed by software packages The data should be presented in a comprehensive way for human users so they will be able to make decisions The dimensionality of the image bands must be reduced to three bands (or less) to display on a standard tristimulus display.
Comprehensive Representation (1) • Summarization: Accurately summarizes all or some of the original data based on the need. • Consistency: Recognition across images in terms of color. • Natural palette: Creating a natural palette of colors, producing preattentive colors when appropriate but not creating noninformative distractions • Computational ease: Real time usage or interactivity
Comprehensive Representation (2) Appropriate pre-attentive features: The visualization minimizes pre-attentive features of the image that distract the viewer without reason. Generalizability: The visualization method workswith N bands, for a wide range of values of N, and where N could vary for spectral zooming, or for a change of instrument. Edge representation: Edges in the original hyperspectral image are represented faithfully in the visualization.
Comprehensive Representation (3) • Equal-energy white point: A data vector with the same value for each component appears gray. At the extremes, a value of zero for all components maps to black, and the maximum value for all components maps to the white point of the display. • Equal luma rendering: An equal brightness is one way to specify that all data components are given equal emphasis in the display
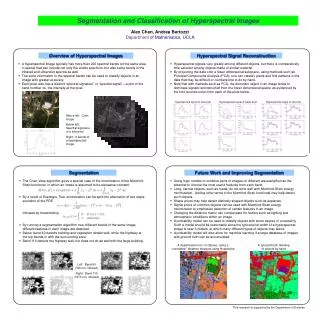
1BT Based Band Selection • Method uses the one-bit transform of hyperspectral image bands to select three suitable bands for RGB display. • 1BT method was initially used for motion detection • 1BT obtains well structured hyperspectral image bands suitable for the color display of available information • Low complexity, very suitable for hardware implementation
Applying 1BT A 17×17 sized multi band-pass filter kernel is defined by Apply the kernel above to each hyperspectral band Compare the result against the original image band using where IF(i,j) is the filtered form of the image frame I(i,j).
Measure of Band Characteristics The spatial bit transitions in 1BTs (changes from 1 to 0, and vice-versa) are counted and the total number of transitions in horizontal and vertical directions of each band is used as a measure of structure.
Obtaining Well-Structured Bands Image bands are regarded to be wellstructured and retained if their A(l) values are below a local threshold T(l) (moving average) The local thresholding approach ensures that more informative bands in local neighborhoods are selected, discarding less informative bands. The threshold can be defined by T(l) = a×t(l) where a is a constant used as threshold weighting factor to allow flexibility in the number of retained bands.
Selecting Three Bands for Color Display The three image bands that are the least alike are selected. Initially the two least similar bands are selected. The two bands that give that highest total EX-OR result will have the largest difference and are selected as the two least similar well-structured image bands. The third band is selected as the band which is again least alike to the already selected two bands. For this purpose the total sum of the EX-OR results of the remaining bands with the first and second selected bands are added up, and the band giving the largest sum is selected.
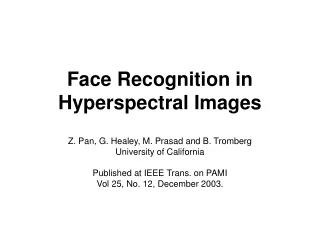
Principal Component Analysis (PCA) • The PCA employs the statistic properties of hyperspectral bands to examine band dependency or correlation
PCA – Data Processing • See Rita Osadchy’s slides on PCA here • An image pixel vector for the PCA algorithm is calculated as:
Principal Components Analysis (PCA) For an N-band hyperspectral image, the first three principal components are the three N-dimensional, orthonormal basis vectors that capture the most data variance; spatial information is not used. The N-band image pixels are linearly projected onto these three N-dimensional basis vectors to create three image bands. The three bands can be mapped to RGB, HSV, etc. for display
PCA - Pros • A standard method for reducing the dimensionality • Materials with similar spectral characteristics are presented in similar hues, and basic classification and clustering decisions can be made by the observer
PCA - Cons • Very saturated regions. • The PCA bands correspond to the maximum data variance, but mapping those three bands to R,G, and B does not necessarily yield maximum human visual discriminability. • Colors ‘pop-out’ and draw attention. Since PCA maps colors without a fixed semantic meaning, bright saturated color regions can be distracting. • High computational complexity.
Spectral Weighting Envelopes • Consider an original N-band image, where λn [i, j] denotes the value of the nth hyperspectral of the ith row and jth column pixel, where n = 1, . . . , N. Let rn, gn, and bn for n = 1, . . . , N be weights on the nth spectral band. Then the proposed visualizations are linear integrations of the form:
Spectral Weighting Envelopes • R, G, and B to be fixed linear integrations of the original hyperspectral image weighted by three different spectral envelopes. • Focus on useful fixed spectral envelopes in order to satisfy the consistency goal for representing hyperspectral images
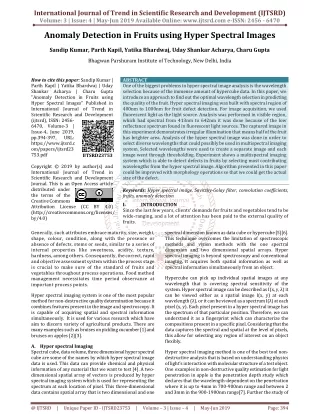
Stretched CMF Basis CIE 1964 color matching functions transformed to the sRGB color space normalized and stretched across the available wavelengths
Stretched CMF Basis - Discussion • The middle data components are more emphasized than those at the end in terms of luminance and saturation • The change of hue across the spectrum is uneven • Can lead to colors that are outside of the sRGB gamut, such as negative sRGB values.
PCA Example • The legend for monochromatic spectra is calculated basing on a specific image • Display mapping: (P1, P2, P3) → (R, G, B).
Envelopes Based on Linear Functions Envelopes based on piecewise linear functions provide more even hue changes as the spectrum varies, particularly at the extremes of the spectral range
Unwrapped Cosine Basis Strong changes in luma across the data components The hue of the basis colors does not change at a constant rate over the data components
Constant-Luma Disc Basis - Cons • Colors are equally saturated, but only a few hues (cyans and reds) are fully saturated, while greens and purples are undersaturated at this luma value. • Interpretability is decreased because the endpoint colors are nearly identical.
Constant-Luma Border Basis Maintaining a balance between the equal chromatic differences and the best use of the sRGB gamut Data points with the maximum value for each component are rendered as offwhite This basis has similar strengths as the constant-luma disc, but has distinct endpoint colors.
Data Scaling and Effective Gamut In order to fit the available gamut, it is necessary to rescale the input data in a consistent way. A raw data vector z is normalized as follows to create the normalized vector x that is then linearly projected: If the data is Kronecker data points, then it may be desirable to scale the input data to be larger by decreasing k.
Adapting Bases to Data SNR In many applications the lowest SNR bands are thrown out as they contain little usable signal Instead, reweight a basis, adjusting the luminance and the chrominance changes to increase monotonically with SNR. Start with a basis that yields equal luminance and equal local chromatic differences, such as the constant-luma border basis. Given original basis functions r, g, and b, the reweighted basis functions for each component are given by Ar, Ag, and Ab, where A is a reweighting matrix formed from the SNR values for each component.
Constructing a Reweighting Matrix • The following constraints are used to construct A. • The sum of the ith row of A is equal to the SNR of the ith component. • The sum of each column of A is 1. • All values in A are nonnegative. • All the nonzero values of A are arranged on a nonbacktracking path from the top left to bottom right. • The matrix A is built from the SNR vector row by row. For each row, begin at the leftmost column of A which does not yet sum to one, and add to it until the column sums to one or until the row sum is equal to the SNR for that component. If the SNR for that row is not exhausted but the column sums to one, then add to the next element in that row. • The result is an SNR-optimized basis with the same total sum for the RGB channels, but which has greater brightness and greater chromatic differences for components with high SNR.
Color Projections With More Info. Combine a color projection of a hyperspectral image with probabilistic information about the class of material for each pix pc - the probability that a hyperspectral vector x is in material class c Generate an overlay color m for the hyperspectral pixel x that is x’s expected color given the probabilistic class memberships For each pixel x, combine its overlay color m with the pixel’s color projection color s, to create a final display color for each pixel f, where
References Design Goals and Solutions for Display of Hyperspectral Images Nathaniel P. Jacobson, and Maya R. Gupta IEEE Trans. On Geoscience and Remote Sensing, Vol 43(11), 2005 http://idl.ee.washington.edu/publications/grspaperJacobsonGupta.pdf Display of Hyperspectral Imagery by Spectral Weighting Envelopes, Nathaniel P. Jacobson and Maya R. Gupta, Proceedings of the IEEE Intl. Conf. on Image Processing, pp. 622-625,2005. http://idl.ee.washington.edu/publications/icip05JacobsonGupta.pdf Linear Fusion of Image Sets for Display Nathaniel P. Jacobson, Maya R. Gupta and Jeffrey Cole IEEE Trans. On Geoscience and Remote Sensing, Vol 45(10), 2007 http://www.umbc.edu/rssipl/people/jwang/citation_4.pdf Color Display for Hyperspectral Imagery Qian Du, ShangshuCai and Robert J. Moorhead, IEEE Trans. On Geoscience and Remote Sensing, Vol 46(6), 2008 http://www.ece.msstate.edu/~du/TGRS-VIS2.pdf A Low-Complexity Approach for Color Display of Hyperspectral Remote-Sensing Images Using OneBit Transform Based Band Selection BegümDemir, Anıl Çelebi, and SarpErtürk http://kulis.kocaeli.edu.tr/pub/tgrs08_hsidisplay.pdf Dimensionality Reduction for Useful Display of Hyperspectral Images J. Cole http://jeffcole.org/academics/image_display/image_display.pdf