Download
1 / 33
340 likes | 453 Views
Challenges in biomass and carbon assessment in Himalayas. PRADEEP KUMAR CHIEF CONSERVATOR OF FORESTS FORESTS, ENVIRONMENT AND WILDLIFE MANAGEMENT DEPARTMENT SIKKIM. 9 million sqkm of the Earth’s surface, 23 %, In India 9 states 63%. Optical. VEGETATION.

E N D
Challenges in biomass and carbon assessment in Himalayas PRADEEP KUMAR CHIEF CONSERVATOR OF FORESTS FORESTS, ENVIRONMENT AND WILDLIFE MANAGEMENT DEPARTMENT SIKKIM
9 million sqkm of the Earth’s surface, 23 %, In India 9 states 63%
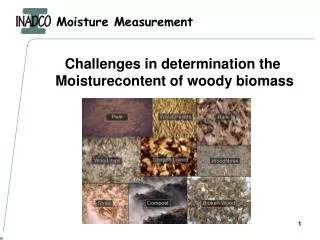
Optical VEGETATION
But foreshortening, layover and shadowing limit the application
As quoted by the company • Weighing less than 10kg, LiDARplatform called the “Phoenix AL-2” combines the latest UAV, LiDAR and GNSS technology. • Could prove to be a cost effective, accurate and safe micro-mapping solution.
“As far as the laws of mathematics refer to reality, they are not certain; and as far as they are certain, they do not refer to reality.” ― Albert Einstein
NEED TO UNDERSTAND WHAT IS GOING TO HAPPEN RATHER THAN JUMPSTARTING TO ADAPTATION
ADAPTATION BASED ON SCIENCE, NOT ON PERCEPTIONS ADAPTATION Understand what is going to happen Model Future Distribution Develop algorithms Current Species Distribution Model Current and Future Climate
In India >90 species of Rhodo. 36 ~40 species in Sikkim. State tree of Sikkim R. niveum.
MODELING PROCEDURE • ‘Mechanistically’ or ‘Correlatively’ • Maxent is a maximum entropy based machine learning program that estimates the probability distribution for a species’ occurrence by finding the probability distribution of maximum entropy based on environmental constraints distribution .
MODELING PROCEDURE • All the bioclimatic layers in file format ASCII were used with resolution of 30ARC seconds. • 70% were used in calibrating the model and remaining 30% were used for testing the model. • 112+63 locations
Bioclimatic variables BIO1 = Annual Mean Temperature BIO5 = Max Temperature of Warmest Month BIO13 = Precipitation of Wettest Month BIO15 = Precipitation Seasonality (Coefficient of Variation) BIO6 = Min Temperature of Coldest Month
Test Statistics • For threshold independent assessment ROC analysis, which characterizes performance of model at all possible thresholds by a single number AUC was used. • The ROC describes the relationship between (sensitivity) and the (1 – specificity).
CLIMATE DATASET • WorldClim database developed by Hijmans et el. • Data resolution 30 seconds (0.93 km x 0.93km = 0.86 km2 at equator • Statistically downscaled datasets obtained from International Centre for Tropical Agriculture 2010 originally downloaded from the IPCC data portal and re-processed using a spline interpolation algorithm of the anomalies
CLIMATE DATASET contd. • The future climate change scenario pertained to HadClim Emission scenario SRES-A1B (corresponding to A1: Maximum energy requirements -emissions differentiated dependent on fuel sources. B: Balance across sources). • Altitude not used in the modelling
Representation of the Maxent model for current distribution of Rhododendron
Projection of the Maxent model for Rhododendron onto the environmental variables for future climate
“Life must be lived forward, But understood backward” -Kierkegaard PAST CLIMATE RECONSTRUCION
Reconstructed late summer temperature (July-September) from Abiesdensa of Eastern Himalaya Bhattacharyya, A., Chaudhary, V., 2003. Some marked cool and warm period in this reconstructed series Cool Period A.D. 1781-1792 A.D. 1881-1810 (-0.31oC) A.D. 1827-1836 A.D. 1850-1859 A.D. 1893-1902 A.D. 1929-1938 A.D. 1970-1978 Warm Period A.D. 1813-1822 A.D. 1938-1846 A.D. 1905-1914 A.D. 1960-1969 A.D. 1978-1987 (+0.25oC) Markedly cool late summer A.D. 1782-1786, A.D. 1830-1831 A.D. 1899, A.D. 1933, A.D. 1975 Much warmer summers A.D. 1777-1779, A.D. 1817, A.D. 1843, A.D. 1904-1906, A.D. 1926-1927, A.D. 1980-1982
Abies densa Forest in and around Zema Sample collected during 2008: 73 cores from 39 trees Preliminary result: Chronology extending from AD 1628-2007 (need further correction of the samples)
Contemporary climate data QUANTITATIVE CLIMATE RECONSTRUCTION BASED ON POLLEN DATA Interpolated climate dataset at each surface pollen site. Correspondence Analysis (CA) Detrended Correspondence Analysis (DCA) Principal Component Analysis (PCA) Redundancy Analysis (RDA) Canonical Correspondence Analysis (CCA) Modern Pollen Calibration dataset Transfer Function Fossil Pollen Weighted Averaging Partial Least Square (WA-PLS) Principal Component Regression, Correspondence Analysis Regression Modern Analog Technique Pollen Diagram Reconstruction