Download
1 / 30
300 likes | 411 Views
DNA repair SNPs Associated with Breast Cancer. By: Brittany Duncan Mentors: Janet Sinsheimer PhD (UCLA) Mary Sehl M.D.(UCLA). What We Aim to Do. To ultimately determine: What SNP and Environmental factors contribute to breast cancer

E N D
DNA repair SNPs Associated with Breast Cancer By: Brittany Duncan Mentors: Janet Sinsheimer PhD (UCLA) Mary Sehl M.D.(UCLA)
What We Aim to Do • To ultimately determine: • What SNP and Environmental factors contribute to breast cancer • Whether a combination of SNPs acting independently might be significant • SNP-SNP interactions associated with breast cancer
Why is this Important? Medical: • Determining SNP associations with Breast Cancer would: • Help predict and prevent future cases Bioinformatics: • Comparing two analysis techniques will: • Help to create generalized method for analyzing future SNP interactions
SNP-Single Nucleotide Polymorphism • A single nucleotide change at one particular locus • Must be present in at least 1% of the population • Can result in genotypic and phenotypic effects ACCGTTGTGACCTGCAGTGGAAACAGTATGA ACCATTGTGACATGCAGTGGAAACAGTGTGA www.dnalandmarks.com/.../marker_systems_snp.html
Mechanisms of DNA Repair NER = nucleotide-excision repair, BER = base-excision repair, MMR = mismatch repair, DSBR =double strand break repair, DRCCD = damage recognition cell cycle delay response, NHEJ = non-homologous end-joining HR = Homologous Recombination
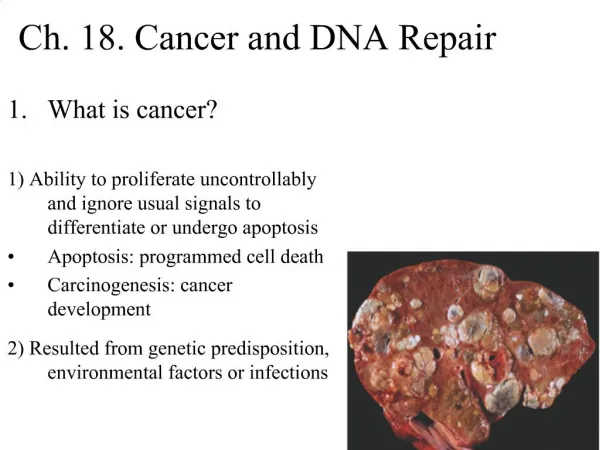
DSBR pathway • DSBR pathway • Double stranded break repair pathway • One mechanism responsible for the repair and maintenance of the integrity of DNA • BRCA1 and 2 key elements in this pathway • Vulnerability to breast cancer may be due to an individual’s capability in repairing damaged DNA
Recreate data found in previous paper Implement Cordell and Clayton: Stepwise regression method Write up results and Create tables Future Direction: Compare results to Lasso method Steps to Success
UCLA Cancer Registry • UCLA familial cancer registry • Participants may have cancer or not but must meet these criteria: • Be 18 yrs or older • Two family members with a same type of cancer or related cancers • Or must have a family history of cancer susceptibility • Mutation in BRCA1 or BRCA2 gene • http://www.registry.mednet.ucla.edu/
Preliminary Work • Case/control study • 399 Caucasian (unrelated) women were chosen for study • 104 SNPs in 17 genes of the DSBR pathway were chosen • Logistic regression analysis conducted on each SNP to determine associations with breast cancer • Adjusted models to include covariates • Findings • 12 significant SNPs
Genotype. Frequency DV DV G – G 199 +0 +0 A – G 143 +1 +1 A – A 19 +2 +1 Additive A allele confers risk in having breast cancer and A-A even more so Dominant A allele confers risk in having breast cancer regardless of number of copies First Step: Defining Variables Example of SNP rs16889040 on RAD21 gene, Chromosome 5 Additive Dominant
Example output from Logistic Regression Dominant Model rs16889040 Coefficients: Estimate Std. Error z value Pr(>|z|) (Intercept) -1.42388 0.72444 -1.965 0.049358 age 0.04464 0.01305 3.419 0.000628 brca1 0.49067 0.39063 1.256 0.209079 brca2 -0.11683 0.49631 -0.235 0.813896 EDUCATION1 0.08139 0.33849 0.240 0.809976 EDUCATION2 0.28671 0.34757 0.825 0.409424 Ashkenazi_status -0.68789 0.28608 -2.405 0.016192 SNP -0.76382 0.27855 -2.742 0.006104 Logit(Y) = B0 + B1X1 ….+ Bn Xn Education
Non-Homologous End Joining Double-Strand Break ATM TP53 BRIP1 Homologous Recombination BRCA1 ZNF350 NBS1 RAD50 XRCC6 XRCC5 BRCA2 MRE11A DNA-PK XRCC3 RAD54L XRCC4 H2AX LIG4 RAD51 XRCC2 RAD52 H2AX RAD21 Repaired DNA
Stepwise Logistic Regression: • Stepwise logistic regression • Cordell and Clayton Method • used 8 genes that had significant SNPs in them • Ran forward regression analysis on each gene • Performed LRT and from test found p-value
Cumulative Effects • Cumulative Effects: SNPs in model but act independently • Findings: • No Accumulation of SNPS were found significant
Interactive Effects Multiplicative effects- interaction between SNPs Findings: • RAD21 Gene interesting but not enough information to be considered significant • SNPd: SNPf • SNPd: SNPg • SNPf: SNPg • Three way interaction was found to be not significant SNPd = rs16888927 SNPf = rs16888997 SNPg = rs16889040
SNP Interactions Using p-value threshold of 0.05 SNPs OR(eβ) p-value . SNPd: SNPf 1.81212 0.090404 SNPd: SNPg 1.76986 0.096392 SNPf: SNPg 1.78383 0.090659
Special Thanks To my amazing mentors at UCLA: • Janet Sinsheimer PhD, Biostatistics lab • Mary Sehl M.D., Dr. Sinsheimer’s lab UCLA For making the SoCalBSI program possible: The wonderful mentors at California State Los Angeles • Dr. Momand , Dr. Warter Perez, Dr. Sharp, Dr. Johnston, Mr. Johnston, Dr. Huebach, Dr. Krilowicz Program Coordinator Ronnie Cheng Funding: American Society of Clinical Oncology – Mary Sehl National Science Foundation - SOCALBSI National Institute of Health - SOCALBSI Economic and Workplace Development -SOCALBSI
Question Slides Recoding for Education Why Use Education? Why Only Caucasian Women? LRT/Chi^2 NEHJ and HR Multiple vs Independent LRT Test Three Way Interaction OR Lasso Method
Recoding for Education Logistic Regression • Education: 1-8 answers in a survey • 1-3 highest education high school (control) • 4-5 some college • 6-8 higher education Educ1 Educ2 1-3 0 0 μ1 = μ + 0X α1 + 0Xα2 4-5 1 0 μ2 = μ + 1X α1 + 0X α2 6-8 0 1 μ3 = μ + 0X α1 + 1X α2 • Coded in 0 and 1 transformation from linear to logistic • Linear: Y = B0 + B1X1 ….+ Bn Xn • Logistic: ln[ pi/(1-pin) ] = B0 + B1X1 ….+ Bn Xn • Y == {0,1} • Essentially the log of the probability of the odds Back
Why Use Education as a Covariate? • Routinely include at least 1 socioeconomic covariate • Education: • Not necessarily because statistically interesting, but because other studies have repeatedly found significance Back
Why Only White Women? • Homogeneous Population • In different populations (men and other ethnicities), different genes may be involved • Not enough sampling of any other group • How data was found: • Registry Website and Questionnaire in English • Location of UCLA • Etc… Back
LRT • Roughly estimated as a chi-squared distribution X2= 3.84 for 1 df P-val = .05 http://www.union.edu/PUBLIC/BIODEPT/chi.html Back
Cell cycle with NEHJ and HR GC- use sister chromatid as template SSA-homologous sequences aligned, residues no longer present are deleted HR Alignment and ligation of termini at DSB http://www2.mrc-lmb.cam.ac.uk/personal/sl/Html/Graphics/CellCycle.gif Lord, Garret, Ashworth Clin Cancer Res 2006; 12(15) Back
Multiple vs. Acting Independently • Cumulative: logit(P(Y)) = α + βTz +Ɣ1SNP1 + Ɣ2SNP2 • Multiplicative: logit(P(Y)) = α + βTz +Ɣ1SNP1 + Ɣ2SNP2 +Ɣ3SNP1*SNP2 Independent Covariates Combinationof two Back
LRT Test Testing for which model fits the data better For a 1 df, 3.84 or higher corresponds to a p-value of 0.05 or lower Alternative model fits the data better Equ: LRT= 2ln(L(HA)/L(H0) ) Less than 3.84 Null model fits the data better Back
Three Way Interaction • logit(P(Y)) = α + βTz +SNPd + SNPf + SNPg +SNPd*SNPf*SNPg Covariates Back
ODDS RATIO • Coded in 0 and 1 transformation from linear to logistic • Linear: Y = B0 + B1X1 ….+ Bn Xn • Logistic: ln[ pi/(1-pin) ] = B0 + B1X1 ….+ Bn Xn • Y == {0,1} • Odds Ratio is eBbecause of Logistic Regression’s Transformed form Back
Lasso Penalized Regression • Exploratory method used when large amount of predictors and small amount of data • Penalizes model for having to many borderline significant predictors • F(θ) = 1/2Σi(yi - μ –Σj(xijβj))2 +λΣj| βj| Least Squares Penalty Term Back