Download
1 / 29
300 likes | 498 Views
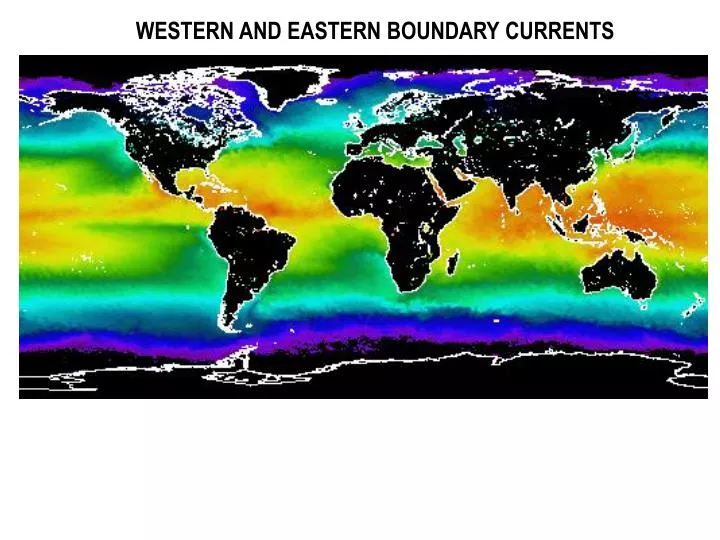
WESTERN AND EASTERN BOUNDARY CURRENTS. Schematic Model of Boundary Currents. Western Intensification from Beta effect. Explanation of Western Intensification. Coriolis constant. Coriolis changing with latitude. Ocean Color. Low Productivity in Western Boundary Currents.

E N D
Western Intensification from Beta effect Explanation of Western Intensification Coriolis constant Coriolis changing with latitude
Ocean Color Low Productivity in Western Boundary Currents - major pathway for heat, salt and nutrients transport to high latitudes - frontal processes of important ecological implications
Sea Surface Temperature image of the Gulf Stream, in yellow and orange. Data from the MODIS instrument on the Aqua satellite. Image provided by Norman Kuring, NASA/GSFC. (oceanmotion.org)
Complete View of the Gulf Stream Poleward transport of heat
Along-stream Momentum Balance U = 1 m/s, V = 0.1 m/s, W = 1x10⁻⁵ m/s, t = 4x10⁵ s, Lx = 5x10⁵ m, Ly =1x10⁵ m, H = 500 m, f = 1x10⁻⁴ s-1, Ax = 10 m2/s, Az=1x10⁻³ m2/s Inertia, Coriolis, Pressure Gradient
Across-stream Momentum Balance U = 1 m/s, V = 0.1 m/s, W = 1x10⁻⁵ m/s, t = 4x10⁵ s, Lx = 5x10⁵ m, Ly =1x10⁵ m, H = 500 m, f = 1x10⁻⁴ s-1, Ax = 10 m2/s, Az=1x10⁻³ m2/s Coriolis and Pressure Gradient = Geostrophy
Gulf Stream Eddies May 1997
Temperature cross-section of a cold-core ring in the Gulf Stream
KUROSHIO CURRENT (Black Water)
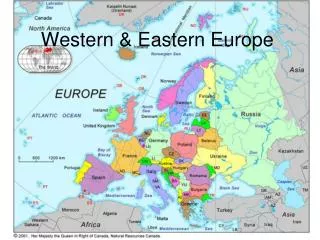
Long-term mean geopotential anomaly (converted to meters) relative to 1000 db (Hasunuma and Yoshida, 1978) Korea Japan China Philippines
Surface mean currents in the East China Sea derived from geopotential anomaly data from 1953-1984 (Qiu and Imasato, 1990). Korea Japan China Taiwan
with respect to 700 db. (Guo et al., 2003)
Velocity profile along the ASUKA line: Geostrophic calculation with a reference level at 2000 m in the deep area and at the bottom in the shallow area (S. Imawaki 1995) Contour interval is 0.1 m/s; shaded areas denote negative values.
Kuroshio path in 2000 (from the Bulletin of Oceanic Conditions, published by the Japanese Coast Guard)
Weak Winds Strong Winds
PF = Polar Flow CJ = Coastal Jet GF = Geostrophic Flow (From Tomczak)