Download
1 / 25
250 likes | 258 Views
Observed c limate changes in Southern South America Vicente Barros San José de Costa Rica May 27, 2003. LINEAR TENDS TENDENCIAS ANUALES 1956 – 1991 mm/year. Surface temperature trend: Subtropical region. Surface temperature trends Resumme : Subtropical region

E N D
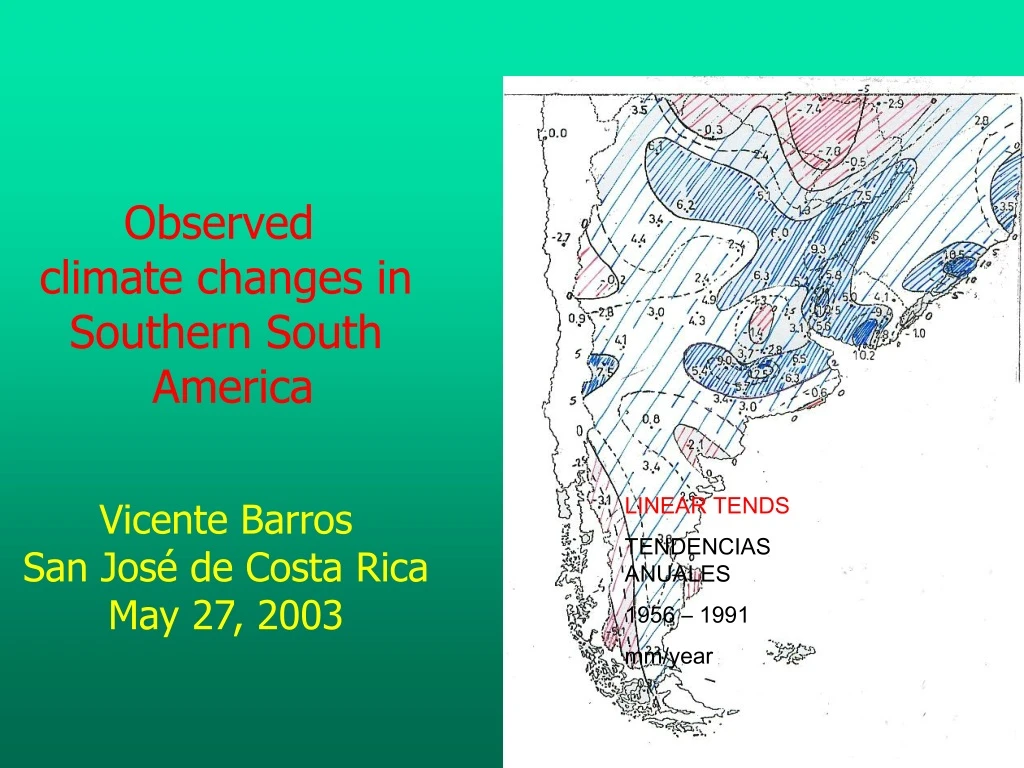
Observed climate changes in Southern South America Vicente Barros San José de Costa Rica May 27, 2003 LINEAR TENDS TENDENCIAS ANUALES 1956 – 1991 mm/year
Surface temperature trends Resumme: Subtropical region Mean temperature: no apreciable changes Positive trend in minimum temperature Negative trend in maximum temperature Patagonia region Positive trends in mean temmpertaure Increasing toward the south
LINEAR TENDS TENDENCIAS ANUALES 1956 – 1991 mm/year
Mean annual precipitation
Isohiets shift to the west
Is the hydrological change a response to climate or to land use change? • If it is response to both: • how much is due to eachone?
Precipitation on the Plata basin (m3 s-1) Discharge (m3 s-1) Evaporaction + Infiltration (m3 s-1) 1998 107000 36600 70400 1999 81600 20440 61600 Difference 23 % 44 % 13 % El Niño 76000 25250 50750 La Niña 71000 21640 49360 Difference 7 % 17 % 3 % 1951-1970 72000 19300 52700 1980-1999 83500 26000 56500 Difference 16 % 35 % 9 % HYDROLOGY: AMPLIFICATION OF THE CLIMATE SIGNAL [1]For lack of available precipitation records north 20ES during the 1951-1970 period, rainfall rates over La Plata basin for this and for the 1980-1999 period were calculated only for the area south of this latitude.
Wavelet Analysis of the mean monthly streamflow of the Paraná River (1931-2001), showing the increament of the components of 4 and 8 years since the 70’s by Angel Menendez
Greatest discharges in the ParanáRiver (Jaime & Menéndez, INA)
Greatest ebbs in the Paraná River (Jaime & Menéndez, INA)
The new conditions are more frequently out of the coping range
1997/98 Floodof the Paraná River (Satellite imagens from CONAE)
Rainfall anomalies for April (+) of El Niño events (1950-99)
BENEFITS • The agriculture frontier shifted westward • Greater productivity in the humid Pampas • More hydropower
DAMAGES • Tropical deseases • More frequent floods • Increased litigation
Are these changes related to the increased Greenhouse gasses concentrations?
CONCLUSIONS • Southeastern South America had an important increase in Precipitation • This change was enhanced in some hydrological systems • It caused important economic benefits and damages • It could be related to GHG human emissions