Download
1 / 39
390 likes | 401 Views
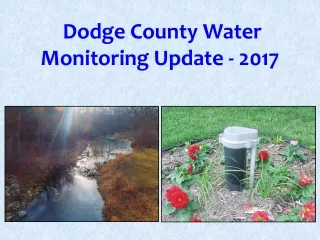
Nitrogen in Dodge County Ground and Surface Waters. To better understand ground water, it’s important to visualize the rock layers, most of which serve as drinking water aquifers, which exist under Dodge County, moving from deepest to shallowest. Source: Minnesota DNR. Source: Minnesota DNR.

E N D
Nitrogen in Dodge County Ground and Surface Waters
To better understand ground water, it’s important to visualize the rock layers, most of which serve as drinking water aquifers, which exist under Dodge County, moving from deepest to shallowest. Source: Minnesota DNR
Let’s cut through the rock layers and expose them from a side view.
Ellington Concord Milton WEST EAST 1300 1300 Elevation Above Sea Level (ft) 1200 1200 SOIL, SAND & GRAVEL GALENA LIMESTONE 1100 1100 DECORAH SHALE 1000 1000 ST. PETER SANDSTONE 900 900 PRAIRIE DU CHIEN DOLOMITE/SANDSTONE 0 1 2 3 4 5 6 Miles Generalized Geographic Formations Underlying Ellington, Concord and Milton Townships Subsurface Geologic Cross-Section In general, the thicker soils in the western portion of the county provide more protection from surface contaminants reaching the rock layers. Source: Dodge County Environmental Atlas
Ellington Concord Milton WEST EAST 1300 Shallow Well, < 50 Ft. to Bedrock 1300 1200 1200 SOIL, SAND & GRAVEL Elevation Above Sea Level (ft) GALENA LIMESTONE 1100 ~60% of all wells 1100 DECORAH SHALE 1000 1000 ST. PETER SANDSTONE ~15% of all wells 900 900 PRAIRIE DU CHIEN DOLOMITE/SANDSTONE ~ 10% of all wells 0 1 2 3 4 5 6 Miles Deep river valleys in the eastern portion of the county can erode the protective shale layer, exposing the layers below to contamination. Subsurface Geologic Cross-Section Generalized Geographic Formations Underlying Ellington, Concord and Milton Townships Source: Dodge County Environmental Atlas
Claremont Wasioja Mantorville EAST WEST Elevation Above Sea Level (ft) 1300 1300 SOIL, SAND & GRAVEL 1200 1200 1100 1100 GALENA LIMESTONE 1000 1000 DECORAH SHALE 900 900 ST. PETER SANDSTONE PRAIRIE DU CHIEN DOLOMITE/SANDSTONE 0 1 2 3 4 5 6 Miles Subsurface Geologic Cross-Section Generalized Geographic Formations Underlying Claremont, Wasioja, and Mantorville Townships Source: Dodge County Environmental Atlas
Ripley Ashland Canisteo WEST EAST Elevation Above Sea Level (ft) 1300 1300 SOIL, SAND & GRAVEL 1200 1200 1100 1100 GALENA LIMESTONE 1000 1000 900 900 DECORAH SHALE ST. PETER SANDSTONE PDC Subsurface Geologic Cross-Section Generalized Geographic Formations Underlying Ripley, Ashland, and Canisteo Townships Source: Dodge County Environmental Atlas
WEST Westfield Hayfield Vernon EAST Elevation Above Sea Level (ft) 1300 1300 SOIL, SAND & GRAVEL 1200 1200 CEDAR VALLEY-MAQUOKETA LIMESTONE 1100 1100 1000 1000 GALENA LIMESTONE 900 900 DECORAH SHALE ST. PETER SANDSTONE PDC 0 1 2 3 4 5 6 Miles Subsurface Geologic Cross-Section Generalized Geographic Formations Underlying Westfield, Hayfield, and Vernon Townships Source: Dodge County Environmental Atlas
MN Dept. of Health Drinking Water Standard – 10mg/L Levels Beyond 10 mg/L Cause Health Risks to Infants and Expectant Mothers Source: Minnesota Dept. of Health; Dodge County Environmental Services
Presence of Coliform Bacteria in Well Water Indicates Surface Contaminants and Disease-Causing Organisms May be Present. E. Coli is a More Serious Disease-Causing Type of Coliform Bacteria. Source: Minnesota Dept. of Health; Dodge County Environmental Services
High nitrate wells occur most frequently in the Highly Sensitive Groundwater Area, where depth-to-bedrock is less than 50 ft, or where underground sand lenses exist. Source: Minnesota DNR; Dodge County Environmental Services
Nitrate levels > 1 mg/l in the St. Peter Sandstone are a reason for concern. Source: Dodge County Environmental Services
Areas of Dodge County where the St. Peter Sandstone is shallow and vulnerable to surface contamination. Source: Minnesota DNR
Comparative Surface Water Nitrogen Load by Subwatershed Source: MPCA – Draft Zumbro Watershed WRAPS Document 2015
Source: MPCA - Nitrogen in Minnesota Surface Waters June 2013
Statewide Nitrogen Sources to Land Source: MPCA - Nitrogen in Minnesota Surface Waters June 2013
Source: MPCA - Nitrogen in Minnesota Surface Waters June 2013
MN Nutrient Reduction Strategy Source: MPCA – Minnesota Nutrient Reduction Strategy December 2014
Phophorous & Nitrogen Goals for the Mississippi Basin Source: MPCA – Minnesota Nutrient Reduction Strategy December 2014
Reducing Nitrogen Losses 1 2 3 1 Fertilizer and Tillage Practices 2 Drainage Practices 3 Cover Crop Practices Source: MPCA – Minnesota Nutrient Reduction Strategy December 2014
Nitrate-Related Ground Water Projects: Dodge County Volunteer Nitrate Monitoring Network • A grant-funded network operating across SE MN since 2007. • Approximately 100 private well owners participate in Dodge County, sampling their wells every 6 months. • The Dodge County network is sub-divided into one baseline, and three targeted, groups. The targeted groups are: • Wells monitoring areas near known high-nitrate wells. 2) Wells monitoring areas near existing sinkholes. 3) Wells monitoring the region along the Decorah Edge.
Dodge County Volunteer Nitrate Monitoring Network Results MN Dept. of Health Drinking Water Limit = 10 mg/l 0 – 1 mg/l is considered back- ground level Nitrate Level (mg/l) The recent upward trend in nitrate level may be due , in part, to recent near-drought conditions, which tend to concentrate nitrate in the drinking water aquifers. Source: Dodge County Environmental Services
Nitrate-Related Surface Water Programs & Projects: Dodge County 50-Foot Stream Buffer Program Before After Buffers provide a deterrent to the movement of soil and nutrients into the stream.
Nitrate Level (mg/l) Date Field tile drainage is diverted through the woodchips, where a high percentage of nitrate is removed. Source: Dodge County Environmental Services
Using Saturated Buffers for Nitrate Removal Field tile water runs through a perforated tile parallel to the buffered ditch or stream, allowing limited drainage through the buffer, which reduces nitrate levels. Source: Dodge County Environmental Services
Dodge County Saturated Buffer MN-4: 2014 Results 14.0 12.1 6.8 4.2 Nitrate Levels (mg/L) 9.9 Source: Dodge County Environmental Services
Edge-of-Field Monitoring Stations MN Dept. of Ag. Grant Site Discovery Farms Site Water samples are gathered and analyzed, providing accurate information to producers on nutrients that leave their fields during snow-melt and runoff events. Source: Dodge County Environmental Services
Most Recent Pollution Results for Minnesota Waters Source: MPCA – Swimmable, Fishable, Fixable? April 2015
Most Recent Pollution Results for Minnesota Waters Source: MPCA – Swimmable, Fishable, Fixable? April 2015
Most Recent Pollution Results for Minnesota Waters Source: MPCA – Swimmable, Fishable, Fixable? April 2015