Download
1 / 23
230 likes | 379 Views
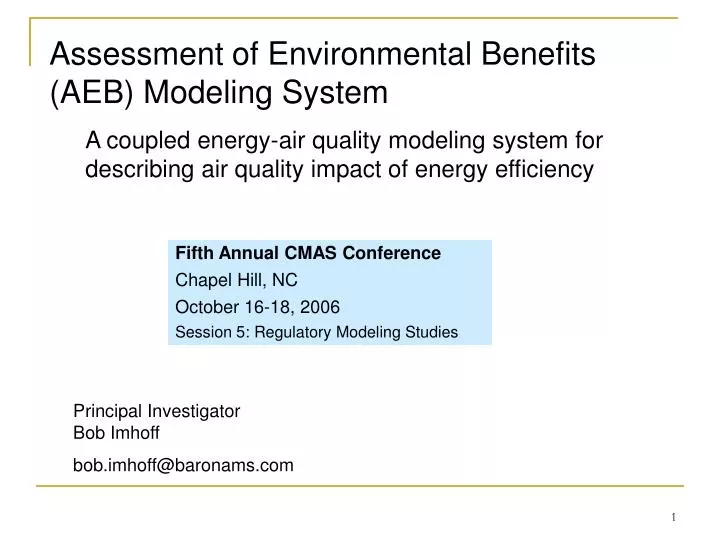
Assessment of Environmental Benefits (AEB) Modeling System A coupled energy-air quality modeling system for describing air quality impact of energy efficiency. Fifth Annual CMAS Conference Chapel Hill, NC October 16-18, 2006 Session 5: Regulatory Modeling Studies.

E N D
Assessment of Environmental Benefits (AEB) Modeling System • A coupled energy-air quality modeling system for describing air quality impact of energy efficiency Fifth Annual CMAS Conference Chapel Hill, NC October 16-18, 2006 Session 5: Regulatory Modeling Studies Principal Investigator Bob Imhoff bob.imhoff@baronams.com
Assessment of Environmental Benefits Modeling System (AEB) Objective • Get SIP Credit for Air Quality Benefits of Energy Efficiency Technologies: • How do we make the case? • Link together accepted models using new S/W tools and new methods • ORCED = Oak Ridge Competitive Electricity Dispatch model (Stan Hadley, ORNL) • SMOKE • CMAQ • Follow USEPA Guidance of August 5, 2004 to ensure emission reductions will be: Quantifiable, Surplus, Enforceable, Permanent
Source Domain for CMAQ Sensitivity Analyses Southern + TVA + VACAR subregions; that portion of SERC that most closely resembles VISTAS
CMAQ modeling scenarios Future base case: VISTAS OTW 2018 F4 Modeling time period: 1 year Met data: 2002 (VISTAS) Grid resolution: 36 km
“Power-gen Pictogram” originated by Stan Hadley of ORNL, developer of the ORCED power dispatch model
Results – SO2 Reductions, joint action Coordinated EE implementation improves NC-only results by 35% from 43k tons to 58k tons
Results – 2018 Reductions at Current Costs Market rates for Allowances from Evolution Markets, Inc. at http://www.evomarkets.com/emissions/index.php?xp1=so2 and http://www.evomarkets.com/emissions/index.php?xp1=sipnox
Results – 2018 Reductions at Projected Cost Beyond 300k Annual Tons SO2 Reduction: $5,000/ton* NOx Allowance: $5,000/ton** *according to recent analysis by G. Stella of Alpine Geophysics, SO2 reductions costs increase exponentially beyond 300k tons reduced **approximate value indicated for 2018 by EIA in AEO2005
Results – 2018 Reductions, Conservative Projection of Costs and Demand Impact SO2 Reduction: $2,115/ton* NOx Allowance: $3,000/ton** *average of per ton cost for annual reductions less than 300k tons (data from analysis by G. Stella of Alpine Geophysics) **approximately mid-way between present day trade value and projection by EIA for 2018
Conclusion: Linkage Between Energy Modeling and Air Quality Modeling with AEB SM Sensitivity Matrix captures the intelligence of CMAQ modeling runs with pollutant-specific, gridded, hourly sensitivity factors. Expresses the modeled sensitivity of emissions and the ambient air in response to changes in power demand Principal benefit: states’ tool for characterizing emissions and air quality benefits from EERE technologies / programs.
Acknowledgments • Bob Imhoff (BAMS),Principal Investigator • Jerry Condrey (BAMS), software tool development • Stan Hadley (ORNL), demand projections and power dispatch modeling • Ted Smith (BAMS), server side development (output products) • Joe Brownsmith (UNCA), EUI development • Dr. Saswati Datta (BAMS), data analysis • Jesse O’Neal (BAMS) project management and outreach • Marilyn Brown and Barbara Ashdown (ORNL), project directors Questions and comments to: Bob Imhoff Baron Advanced Meteorological Systems (BAMS) bob.imhoff@baronams.com