Download
1 / 24
240 likes | 340 Views
Return to Big Picture. Main statistical goals of OODA: Understanding population structure Low dim ’ al Projections, PCA … Classification ( i . e. Discrimination) Understanding 2+ populations Time Series of Data Objects Chemical Spectra, Mortality Data

E N D
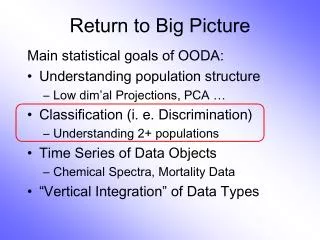
Return to Big Picture Main statistical goals of OODA: • Understanding population structure • Low dim’al Projections, PCA … • Classification (i. e. Discrimination) • Understanding 2+ populations • Time Series of Data Objects • Chemical Spectra, Mortality Data • “Vertical Integration” of Data Types
Return to Big Picture Main statistical goals of OODA: • Understanding population structure • Low dim’al Projections, PCA … • Classification (i. e. Discrimination) • Understanding 2+ populations • Time Series of Data Objects • Chemical Spectra, Mortality Data • “Vertical Integration” of Data Types Qing Feng: JIVE
Return to Big Picture Main statistical goals of OODA: • Understanding population structure • Low dim’al Projections, PCA … • Classification (i. e. Discrimination) • Understanding 2+ populations • Time Series of Data Objects • Chemical Spectra, Mortality Data • “Vertical Integration” of Data Types
Classification - Discrimination Background: Two Class (Binary) version: Using “training data” from Class +1 and Class -1 Develop a “rule” for assigning new data to a Class Canonical Example: Disease Diagnosis • New Patients are “Healthy” or “Ill” • Determine based on measurements
Fisher Linear Discrimination Simple way to find “correct cov. adjustment”: Individually transform subpopulations so “spherical” about their means For define
Fisher Linear Discrimination So (in orig’l space) have separ’ting hyperplane with: Normal vector: Intercept:
Classical Discrimination Above derivation of FLD was: • Nonstandard • Not in any textbooks(?) • Nonparametric (don’t need Gaussian data) • I.e. Used no probability distributions • More Machine Learning than Statistics
Classical Discrimination FLD Likelihood View (cont.) Replacing , and by maximum likelihood estimates: , and Gives the likelihood ratio discrimination rule: Choose Class +1, when Same as above, so: FLD can be viewed as Likelihood Ratio Rule
Classical Discrimination Summary of FLD vs. GLR: • Tilted Point Clouds Data • FLD good • GLR good • Donut Data • FLD bad • GLR good • X Data • FLD bad • GLR OK, not great Classical Conclusion: GLR generally better (will see a different answer for HDLSS data)
Classical Discrimination FLD Generalization II (Gen. I was GLR) Different prior probabilities Main idea: Give different weights to 2 classes • I.e. assume not a priori equally likely • Development is “straightforward” • Modified likelihood • Change intercept in FLD • Won’t explore further here
Classical Discrimination FLD Generalization III Principal Discriminant Analysis • Idea: FLD-like approach to > 2 classes
Classical Discrimination FLD Generalization III Principal Discriminant Analysis • Idea: FLD-like approach to > 2 classes • Assumption: Class covariance matrices are the same (similar) (but not Gaussian, same situation as for FLD)
Classical Discrimination Principal Discriminant Analysis (cont.) But PCA only works like Mean Difference, Expect can improve by taking covariance into account. Blind application of above ideas suggests eigen-analysis of:
Classical Discrimination Summary of Classical Ideas: • Among “Simple Methods” • MD and FLD sometimes similar • Sometimes FLD better • So FLD is preferred • Among Complicated Methods • GLR is best • So always use that? • Caution: • Story changes for HDLSS settings
HDLSS Discrimination Main HDLSS issues: • Sample Size, n < Dimension, d • Singular covariance matrix • So can’t use matrix inverse • I.e. can’t standardize (sphere) the data (requires root inverse covariance) • Can’t do classical multivariate analysis
HDLSS Discrimination Add a 3rd Dimension (noise) Project on 2-d subspace generated by optimal dir’n & by FLD dir’n
HDLSS Discrimination Movie Through Increasing Dimensions
HDLSS Discrimination FLD in Increasing Dimensions: • Low dimensions (d = 2-9): • Visually good separation • Small angle between FLD and Optimal • Good generalizability • Medium Dimensions (d = 10-26): • Visual separation too good?!? • Larger angle between FLD and Optimal • Worse generalizability • Feel effect of sampling noise
HDLSS Discrimination FLD in Increasing Dimensions: • High Dimensions (d=27-37): • Much worse angle • Very poor generalizability • But very small within class variation • Poor separation between classes • Large separation / variation ratio
HDLSS Discrimination FLD in Increasing Dimensions: • At HDLSS Boundary (d=38): • 38 = degrees of freedom (need to estimate 2 class means) • Within class variation = 0 ?!? • Data pile up, on just two points • Perfect separation / variation ratio? • But only feels microscopic noise aspects So likely not generalizable • Angle to optimal very large
HDLSS Discrimination FLD in Increasing Dimensions: • Just beyond HDLSS boundary (d=39-70): • Improves with higher dimension?!? • Angle gets better • Improving generalizability? • More noise helps classification?!?
HDLSS Discrimination FLD in Increasing Dimensions: • Far beyond HDLSS boun’ry (d=70-1000): • Quality degrades • Projections look terrible (populations overlap) • And Generalizability falls apart, as well • Math’s worked out by Bickel & Levina (2004) • Problem is estimation of d x d covariance matrix
HDLSS Discrimination Simple Solution: Mean Difference (Centroid) Method • Recall not classically recommended • Usually no better than FLD • Sometimes worse • But avoids estimation of covariance • Means are very stable • Don’t feel HDLSS problem
HDLSS Discrimination Mean Difference (Centroid) Method • Far more stable over dimensions • Because is likelihood ratio solution (for known variance - Gaussians) • Doesn’t feel HDLSS boundary • Eventually becomes too good?!? Widening gap between clusters?!? • Careful: angle to optimal grows • So lose generalizability (since noise inc’s) HDLSS data present some odd effects…